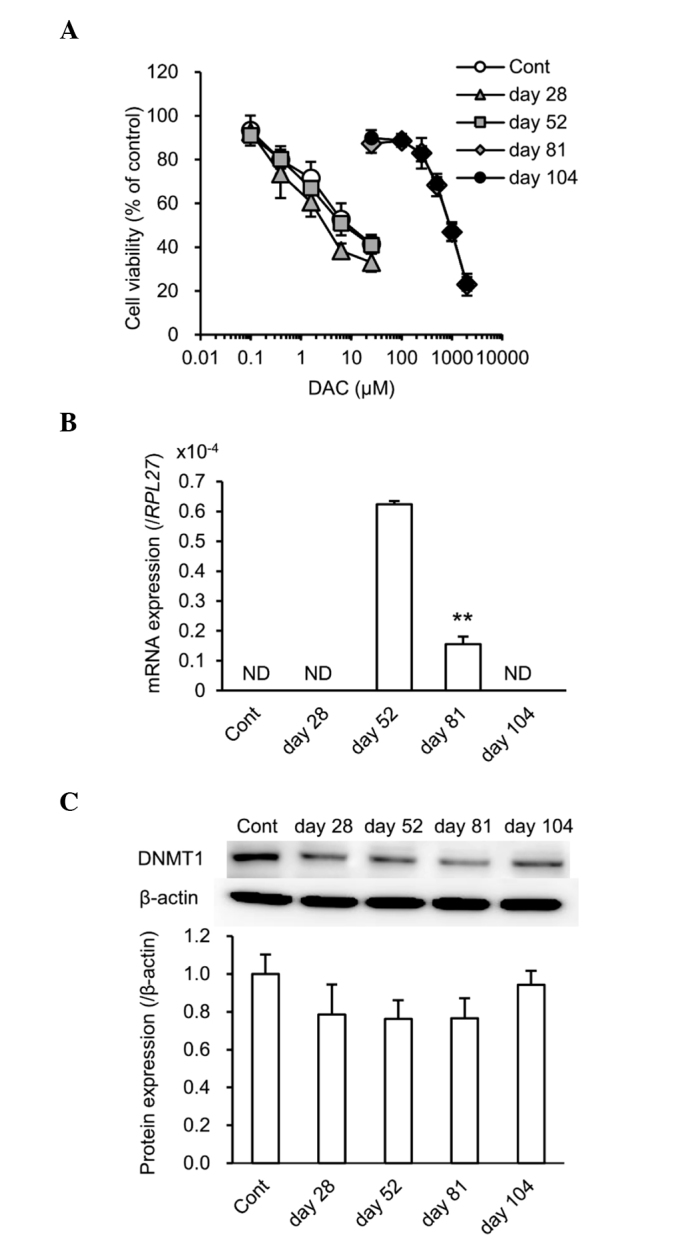
Figure 1.

HCT116 cells acquire resistance to DAC following DAC treatment for 104 days. (A) HCT116 cells treated with DAC for 28, 52, 61 and 104 days were incubated with various concentrations of DAC for 72 h in a 96-well plate. Cell viability was measured using the water-soluble tetrazolium salt-8 assay. (B) SFRP1 mRNA expression in control and DAC-treated HCT116 cells was analyzed by reverse transcription quantitative polymerase chain reaction and normalized to RPL27 mRNA expression. **P<0.01 vs. day 52. (C) DNMT1 protein expression in control and DAC-treated HCT116 cells was analyzed by western blotting. β-actin was used as a loading control. Band intensities were then quantified using Image J software. Values are presented as the mean ± standard error of the mean of three independent experiments. DAC, decitabine; SFRP1, secreted frizzled-related protein 1; RPL27, ribosomal protein 27; ND, not detected; Cont, control; DNMT1, DNA methyltransferase 1.
