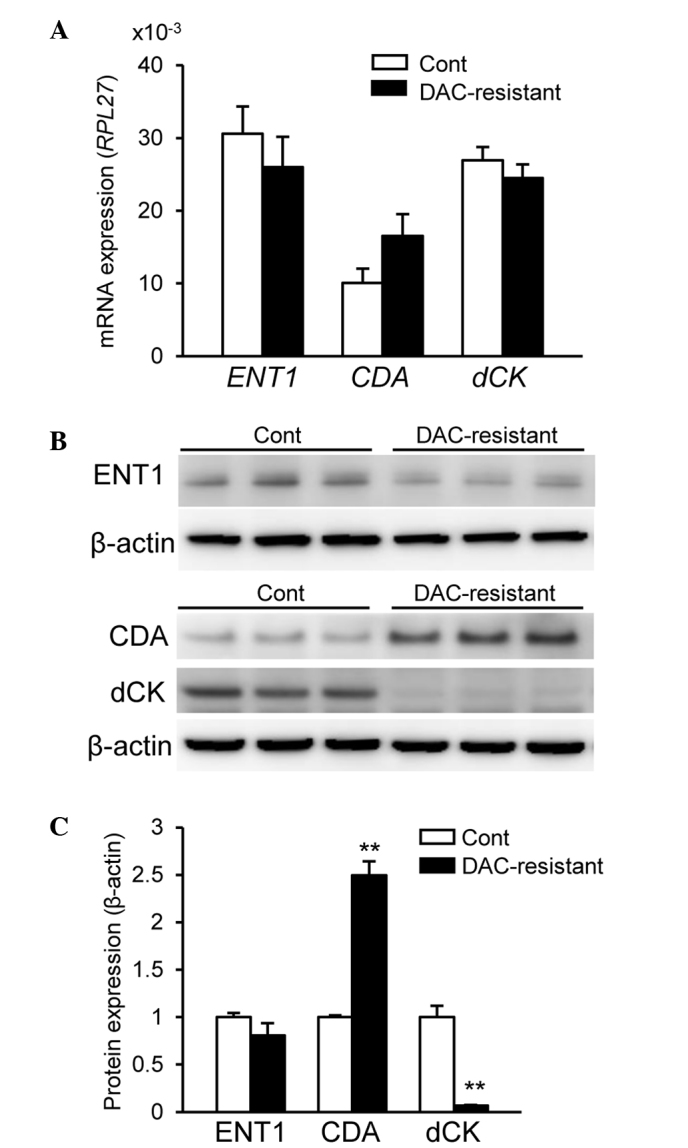
Figure 2.

Altered CDA and dCK protein expression levels in DAC-resistant HCT116 cells. (A) mRNA expression levels of ENT1, CDA and dCK in control and DAC-resistant HCT116 cells were analyzed by reverse transcription quantitative polymerase chain reaction and normalized to RPL27 mRNA expression. (B) Protein expression levels of ENT1, CDA and dCK in control and DAC-resistant HCT116 cells were analyzed by western blotting. β-actin was used as a loading control. (C) Quantification of protein expression by Image J. Values are presented as the mean ± standard error of the mean of three independent experiments. **P<0.01 vs. control HCT116 cells. DAC, decitabine; ENT1, equilibrative nucleoside transporter 1; CDA, cytidine deaminase; dCK, deoxycytidine kinase; RPL27, ribosomal protein 27; cont, control.
