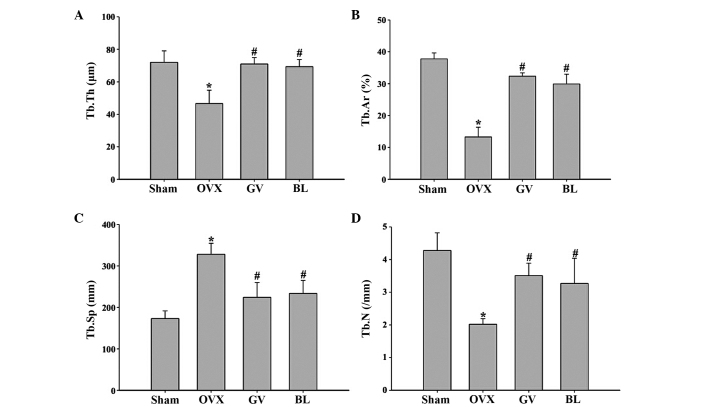
Figure 3.
Histomorphometric analysis of the femurs in the various groups. Image analysis software was used to determine the (A) Tb.Th, (B) Tb.Ar percentage; (C) Tb.Sp and (D) Tb.N. Data are presented as the mean ± standard deviation (n=10). *P<0.01, vs. sham group; #P<0.01, vs. OVX group. Tb, trabecular; Th, thickness; Ar, area; Sp; separation; N, number; OVX, ovariectomized; GV, governor vessel; BL, bladder meridian.

