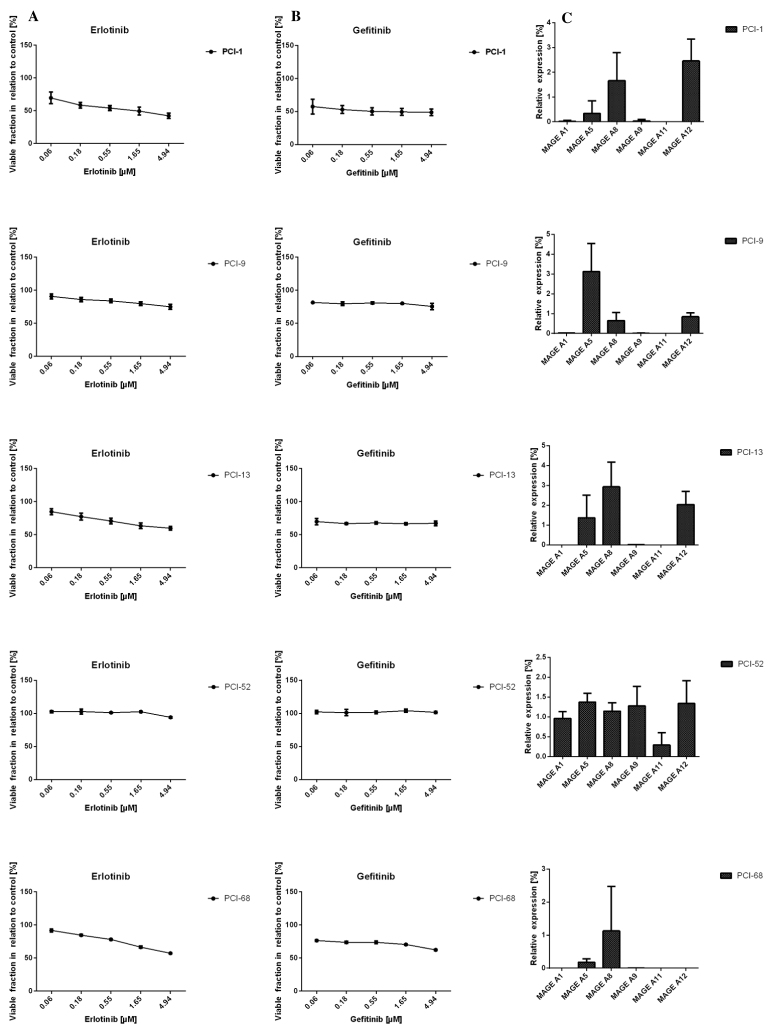
Figure 1.
Effects of erlotinib and gefitinib on cell viability and MAGE-A subgroup expression profiles of head and neck squamous cell carcinoma cell lines. Fraction of viable cells compared with that of the control (100%) following 72 h of (A) erlotinib or (B) gefitinib treatment. With the exception of the PCI-52 cell line, all cell lines demonstrated a marked decrease in viable cells following drug treatment. Standard deviation is illustrated by error bars extending above and below the data points. (C) Cell-specific MAGE-A subgroup expression profile of each cell line, relative to β-actin expression. MAGE, melanoma-associated antigen.

