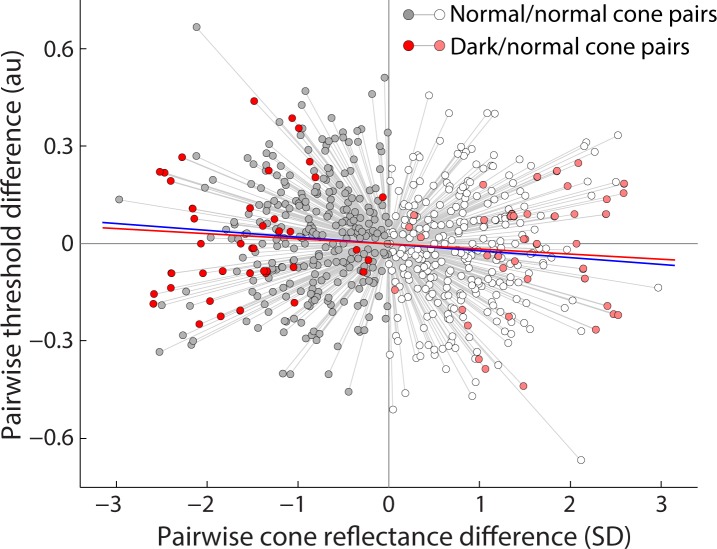
Figure 5.
Comparison of single-cone reflectance and threshold. For both normal/normal (grayscale) and dark/normal (red scale) cone pairs, reflectance values for each cone were normalized to the mean reflectance of each pair during one experiment (indicated by connecting gray lines), expressed in SDs of the field gray level from the pairwise mean. Darker shading (toward the left) represents the less reflective cone in each pair. Cone thresholds were normalized to the mean of each cone pair, and plotted in arbitrary units from the pairwise mean. Linear regression reveals a 3.6% difference in mean threshold between normal cones with less versus more reflectivity (blue line, P = 0.0502, 284 paired threshold measurements). This trend was matched by dark/normal cone pairs, but also did not reach significance (red line, P = 0.49, 41 paired threshold measurements).

