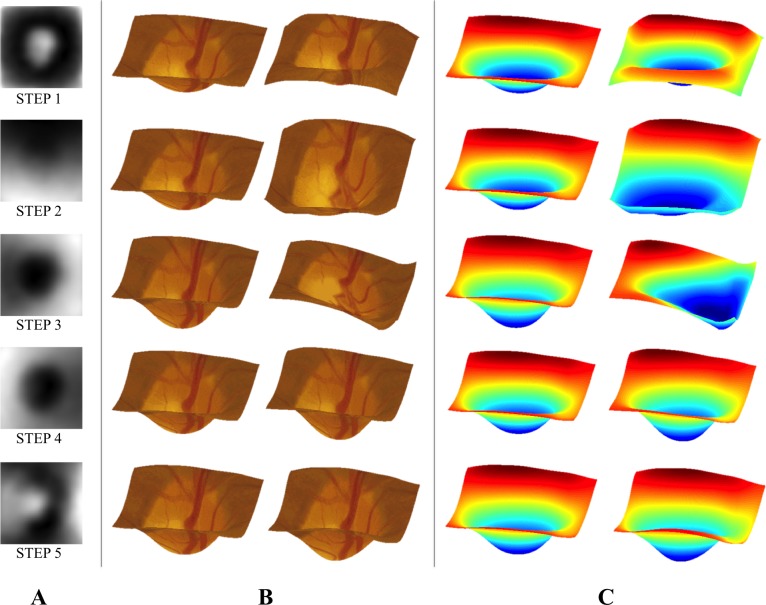
Figure 6.
(A) Grayscale representations of the first five PCA-based STEPs. Here, dark and bright areas indicate regions of the ONH that this feature affects. (B) Visualizations intended illustrate the changes associated with each STEP. A median depth map (left) is shown along with a simulated depth map constructed using an extreme value (the maximum observed value) of the STEP. (C) The same images shown as heat maps to help illustrate depth.

