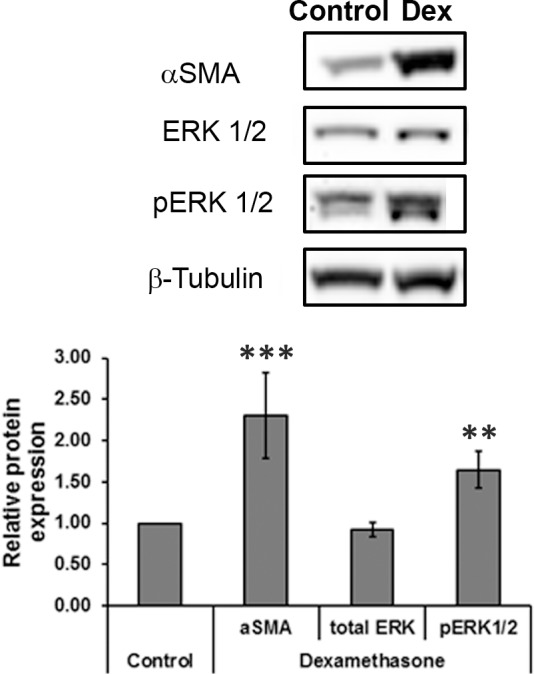
Figure 2.

Representative Western blot comparing the expressions of αSMA, ERK1/2, phosphorylated ERK1/2, and loading control (β-tubulin) in 3-day control and DEX-treated cells. Graph illustrates the mean optical density of the protein bands expressed relative to control cultures. Data are mean ± SD (n = 4 donors). ***P < 0.001, **P < 0.01, Mann-Whitney U test.
