
Figure 3.
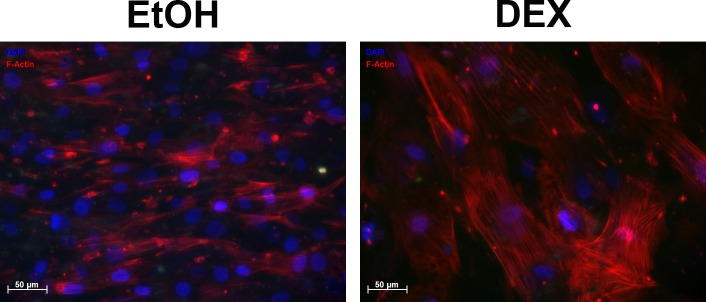
Representative images of HTM cells treated with vehicle control or DEX after 4 weeks. Significantly greater number of stress fibers (F-actin/red; nucleus/DAPI/blue) was observed in the DEX group compared to control (EtOH) cells.
Official websites use .gov
A
.gov website belongs to an official
government organization in the United States.
Secure .gov websites use HTTPS
A lock (
) or https:// means you've safely
connected to the .gov website. Share sensitive
information only on official, secure websites.
Representative images of HTM cells treated with vehicle control or DEX after 4 weeks. Significantly greater number of stress fibers (F-actin/red; nucleus/DAPI/blue) was observed in the DEX group compared to control (EtOH) cells.