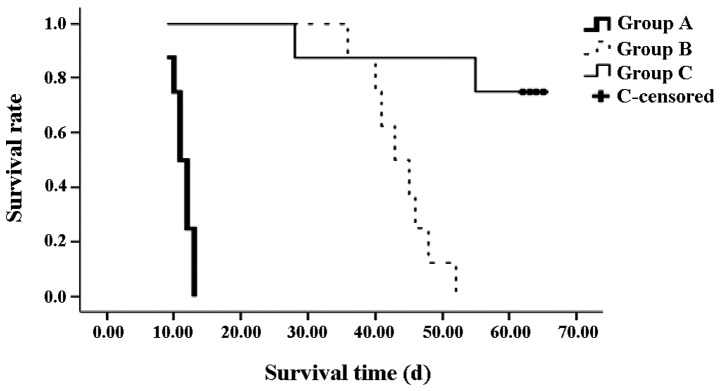
Figure 2.

Survival curve of the recipients in each group following orthotopic liver transplantation. Survival times in groups B and C were significantly longer compared with group A (P<0.01). The survival rate of group C was also higher compared with group B (P<0.01).
