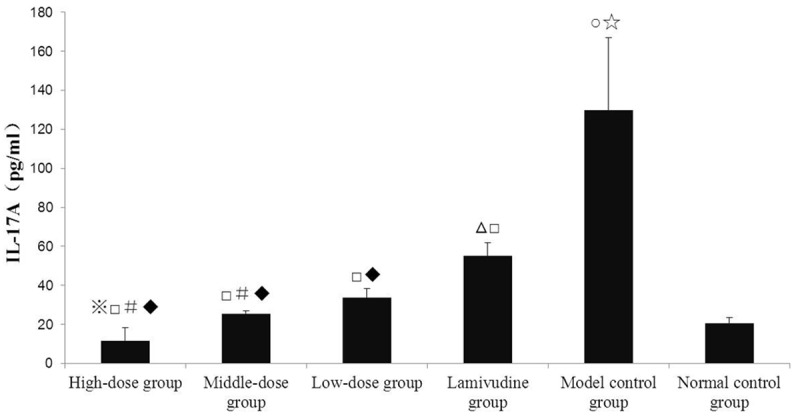
Figure 3.

Comparison of serum IL-17A concentration in each group at 60th day was showed and serum IL-17A concentration in each group at 60th Day was compared to that at 30th day in Figure 2. Notes: 1. ※P < 0.05 compared to high-dose group in Figure 2; 2. ΔP < 0.05 compared to lamivudine group in Figure 2; 3. ○P < 0.05 compared to model control group in Figure 2; 4. ☆P < 0.05 compared to normal control group in Figure 2; 5. □P < 0.05 compared to model control group in Figure 2; 6. #P < 0.05 compared to low-dose group in Figure 2; 7. ♦P < 0.05 each level of decoction compared to lamivudine group in Figure 3.
