
Figure 2.
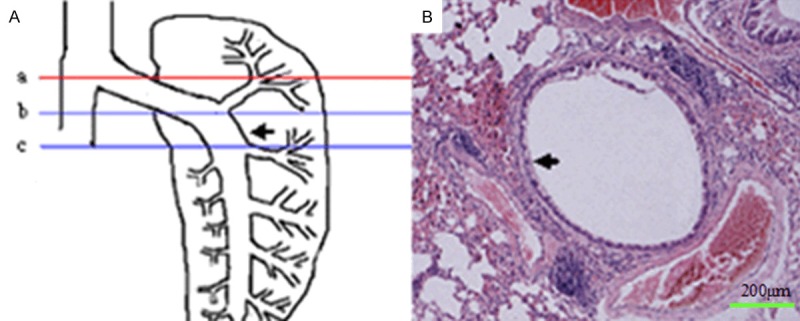
Schematic representation of sample collection and parameter measuring. A. “a” line indicates the site where the porta pulmonis was cut open. The region between “b” line and “c” line was the sites where lung sections were collected. This region was derived by extension of porta pulmonis. The distance between “a” line and “b” line was approximately 1000 μm. The distance between “a” line and “c” line was approximately 1500 μm. At least 3 paraffin sections with a thickness of 5 μm/section were collected from “b” line and “c” line. The arrow in the figure indicates left main bronchus. B. One large bronchus (arrow) and three associated large vessels (one pulmonary artery and two pulmonary veins) were observed in the transaction. This bronchus was selected for the morphometrical analysis.