
Figure 4.
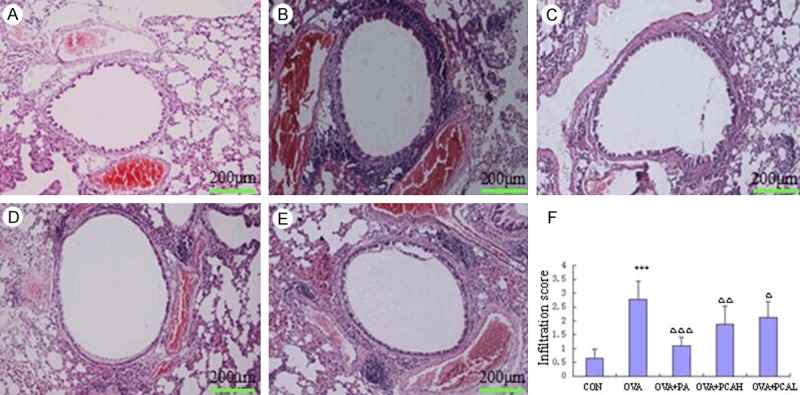
Comparisons of HE staining for left main bronchus (100×) and lung inflammatory cell infiltration score in BABL/c mice. A. Control group: no or rarely seen inflammatory cell infiltration around the airway. B. OVA group: inflammatory cell infiltration around the airway and three large vessels, distributed into pieces or groups, tracheal epithelium and smooth muscle layer significantly thickened compared with the control group, lung interval widened. C. OVA + PA group: compared with the OVA group, airway and perivascular inflammatory cell infiltration significantly reduced, no distribution into groups, no obvious wide alveolar septa compared with the control group. D. OVA + PCAH group: compared with the control group, the airway epithelial lamina and smooth muscle layer had no significant thickening, not obvious widened alveolar septa, but the airway and perivascular inflammatory cell infiltration still increased significantly, occasionally a small amount into the group distribution. E. OVA + PCAL group: showing the airway and perivascular infiltration of inflammatory cells into the group distribution, still widened alveolar septa, the thickness of airway epithelial lamina and smooth muscle layer reduced no obvious than the OVA group. F. comparison of infiltration score of lung inflammatory cells. N = 10, x̅ ± s. ***P < 0.001 compared to COM groups. ΔP < 0.05, ΔΔP < 0.01, ΔΔΔP < 0.001 compared to OVA groups.