
Figure 5.
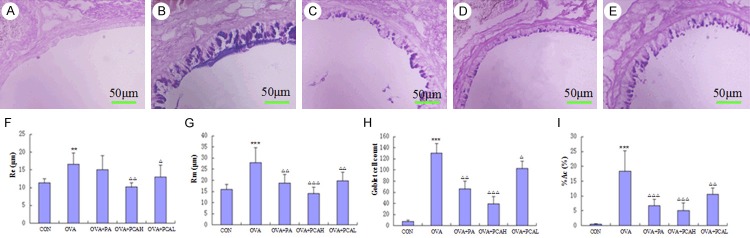
AB-PAS staining (400×) and morphometric measurements of target airway in BABL/c mice. (A) Control group: the airway epithelial lamina and smooth muscle layer was thinner, no positive staining of the epithelial goblet cells. (B) OVA group: compared with the control group, the airway epithelial lamina and smooth muscle layer thickened, positive staining of epithelial goblet cells significantly increased, and goblet cells were hypertrophy, mucus secretion increased in dark purple. (C) OVA + PA group: the thickness of the airway epithelial lamina and positive stained goblet cells significantly reduced compared with the OVA group. (D) OVA + PCAH group: the airway epithelial lamina and smooth muscle layer had no significant thickening, the stained positive epithelial goblet cells were rare, and were close to the level of the control group. (E) OVA + PCAL group: the thickness of airways epithelial lamina and smooth muscle layer decreased compared with the OVA group, the positive stained epithelial goblet cells was still more, but no significant hypertrophy of goblet cells. Quantitative and positioning study of morphometry of lung in AB-PAS staining is shown in (F) (the thickness of smooth muscle layer, Rm), (G) (the thickness of epithelial lamina, Re), (H) (goblet cell count), (I) (the percentage of goblet cell area, % Ac). N = 10, ***P < 0.001 compared to COM groups. ΔP < 0.05, ΔΔP < 0.01, ΔΔΔP < 0.001 compared to OVA groups.