
Figure 3.
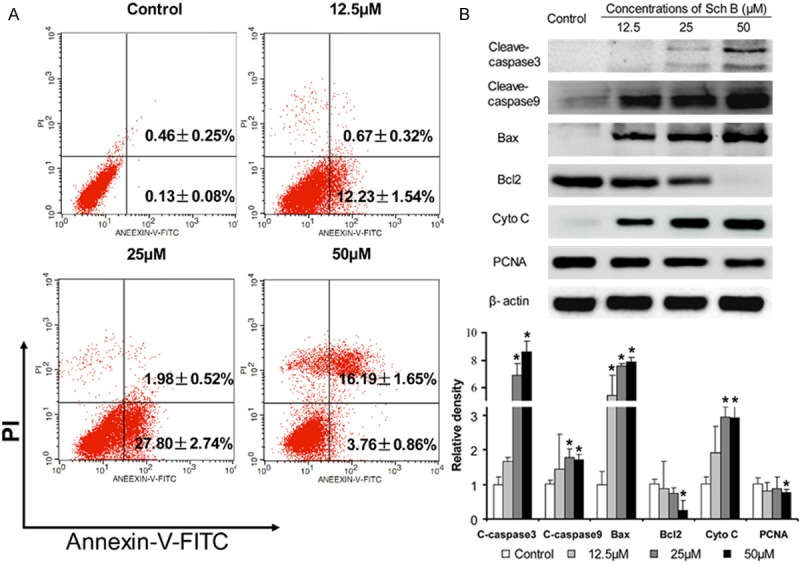
Treatment with Sch B induces the apoptosis of A549 cells. A549 cells were treated with, or without, different concentrations of Sch B for 72 h and stained with Annexin V-FITC/PI, followed by flow cytometry. The relative levels of target protein expression were determined by Western blot assay. Data are representative charts, images, and expressed as the mean ± SD of individual groups of cells from three independent experiments. A. Flow cytometry analysis of the percentages of apoptotic cells; B. Western blot analysis. *P < 0.05 vs. the control, determined by ANOVA and post hoc Bonferroni multiple comparisons test.