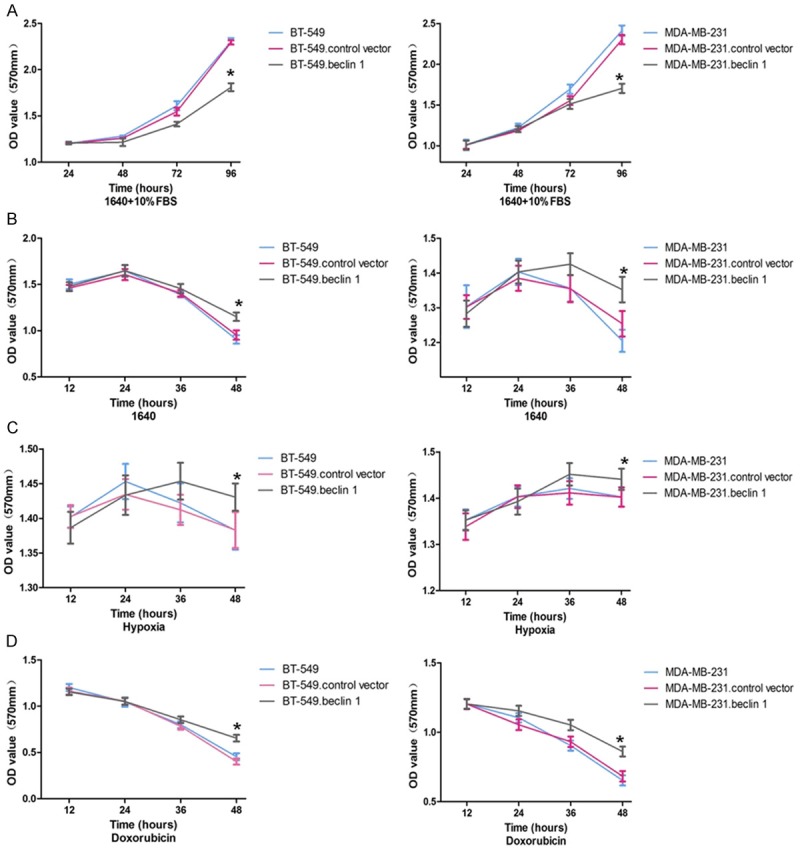
Figure 3.

MTT results of BT-549 and MDA-MB-231 cells cultured in different condintions. A. Cells were cultured in normal condition. B. Cells were cultured in low nutritional condition. C. Cells were cultured in hypoxia. D. Cells were cultured in doxorubicin (2 mg/ml). *P<0.05 vs. blank group. The results are representative of three different experiments.
