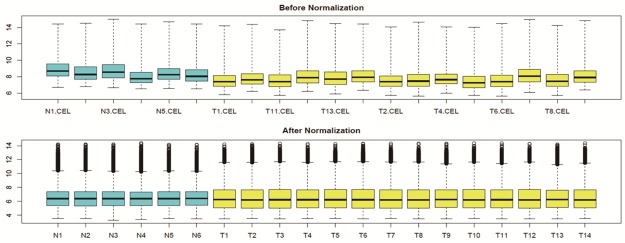
Figure 1.

The box-plot of standardized expression data of normal tissue and OS tissue. The blue ones stand for normal samples while the yellow ones represents patients with OS. The medians of the samples were almost on the second dotted line, which indicated that the degree of standardization was very well.
