
Figure 3.
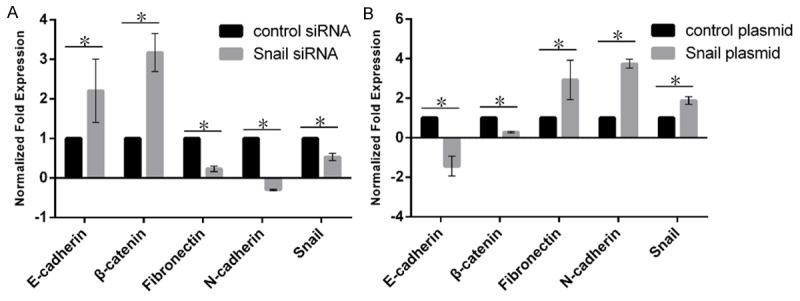
The effect of the expression level of Snail on EMT related molecular markers. A. The effect of Snail on EMT molecular markers in siRNA. B. The effect of Snail on EMT molecular markers in plasmid. The black represents the control group; the gray represents the Snail group. The higher column indicates higher expression level.