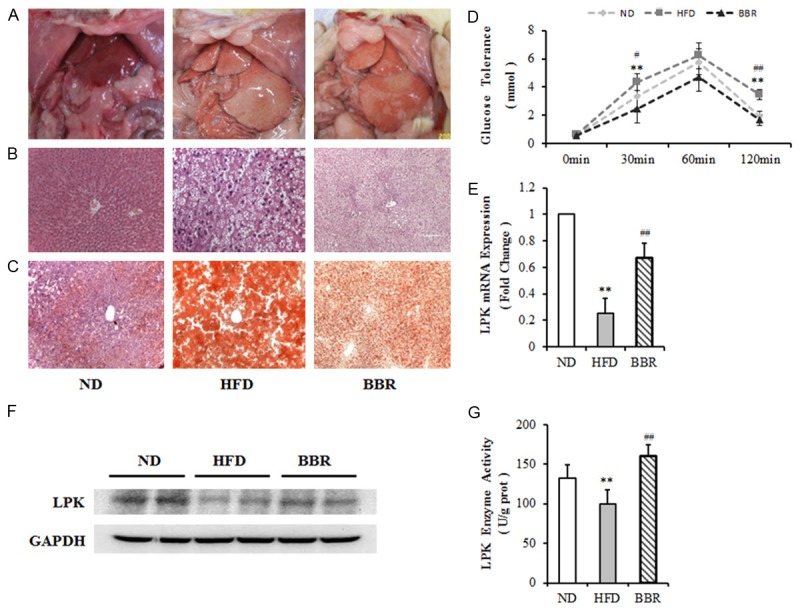
Figure 1.

SD rat NAFLD models were created using a high-fat diet. A. Livers from normal and NAFLD rats stained with H&E (Hematoxylin and Eosin). C. Livers stained with Sudan III. D. Plasma glucose were measured before and 15, 30, 60 and 120 min after an oral glucose load. E. L-PK mRNA expression in the livers of rat NAFLD models. F. L-PK protein level in the livers of rat NAFLD models. G. L-PK enzyme activity in the livers of NAFLD models. n≥6. *P<0.05; **P<0.01 vs. NC. #P<0.05; ##P<0.01 vs. HFD. NC, control group; HFD, high-fat diet-induced NAFLD group; BBR, Berberine treatment group.
