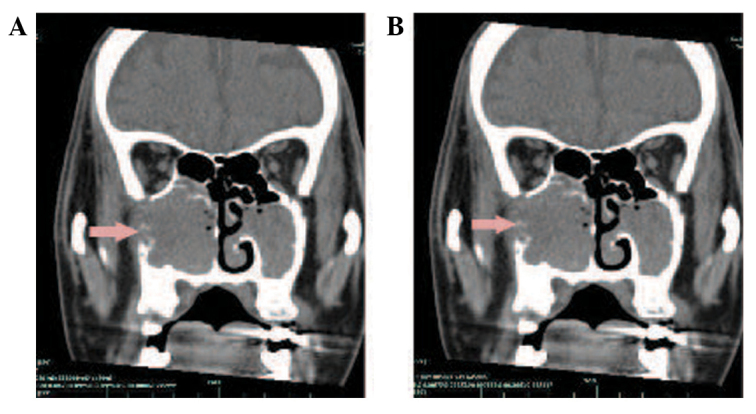
Figure 4.

(A) A computed tomography (CT) scan with soft-tissue masses in the right maxillary sinus and nasal cavity 14 months after radiotherapy in the right submandibular region. The medial, lateral, anterior walls of the right maxillary sinus had been destroyed by the tumour, with a CT value of 28 HU. (B) Contrast-enhanced imaging with marked enhancement of the lesions at 812 HU. Arrows indicate the tumour.
