Fig. 3.
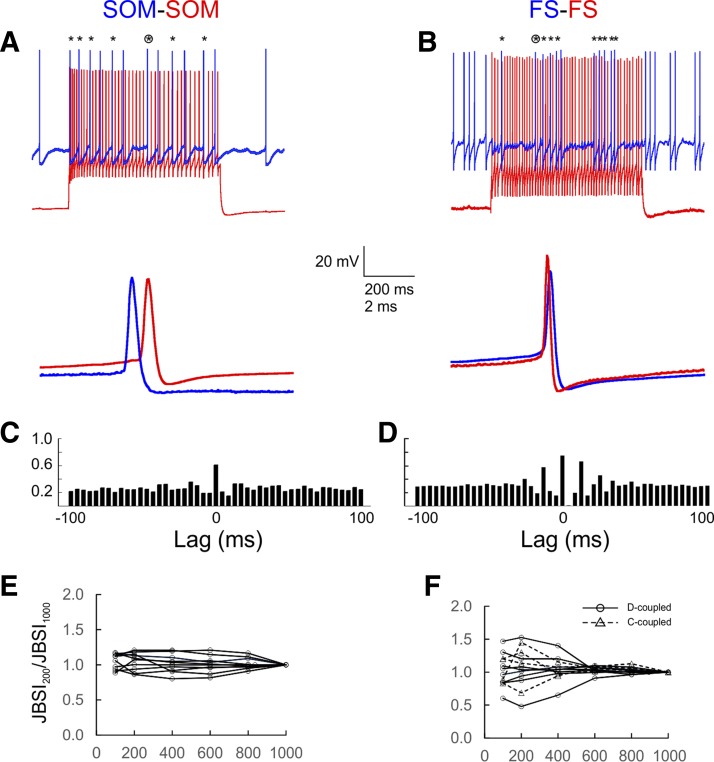
SOM and FS pairs displayed long-lasting, stable firing synchrony. A and B: the basic protocol used to identify and estimate synchrony. One cell in the pair (driver cell; red traces) was strongly activated by 600-ms current steps repeated every 5 s, whereas the other (follower cell; blue traces) was depolarized above threshold by constant current; the red and blue traces are displaced vertically for clarity. Asterisks at top indicate synchronous spikes (peaks within 2 ms of each other); the circled asterisk indicates the spike pair shown at a faster time base at bottom. C and D: a traditional cross-correlogram representation of the same pairs, computed from 400 spikes in the follower cell; bins are 4 ms wide. The height of the central bin indicates the fraction of follower spikes that are within ±2 ms of a driver spike. E and F: a synchrony index (JBSI) was calculated for 10 representative SOM and 12 FS pairs from increasingly longer segments of the full spike train and normalized to its value at 1,000 spikes (JBSI1000); note the short-term fluctuations, especially in FS pairs, but the long-term stability of the JBSI.

