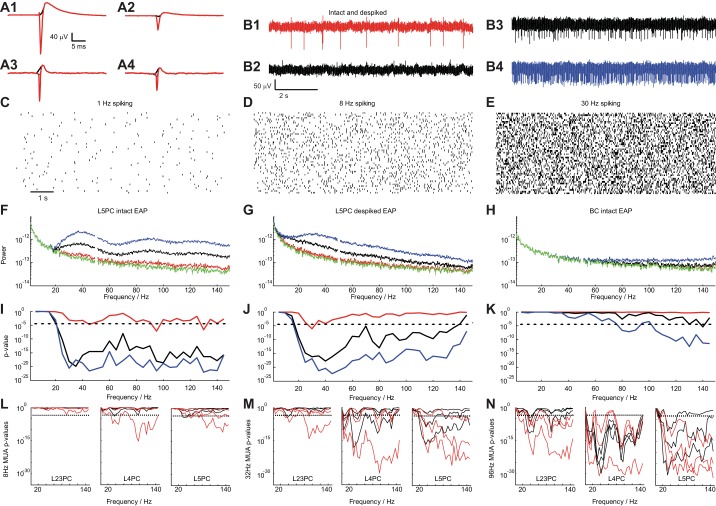
Fig. 7.
Impact of EAPs on the local field potential. A: spike-triggered EAP waveform of a L5PC (A1 and A2) and a L3BC (A3 and A4) (left: from site with largest EAP amplitude; right: from site recording the 2nd largest EAP waveform). The intact EAP waveform is shown (red) as well as the “de-spiked” one where the EAP negativity is missing (black; window of 0.6 ms around spike initiation time is substituted by a spline). B: extracellular traces composed using the L5PC EAP waveform: mean spike rate f0 of 1 Hz with intact waveform (B1), 1 Hz with de-spiked waveform (B2; from A2), 8 Hz (B3), and 30 (B4) Hz with intact waveform. C–E: 50 realizations of a random process (log-normal PDF used to produce the ISI distributions) to create 9-s traces with f0 = 1, 8, and 30 Hz, respectively. F: mean spectral density as a function of temporal frequency for the intact EAP waveform shown in A1 (green: no spiking; red: 1 Hz; black: 8 Hz; blue: 30 Hz). G: same as in F for the de-spiked EAP waveform of the L5PC shown in A1 (black). H: same analysis as in F for the intact EAP waveform of the basket cell shown in A3 (red). I–K: P value (t-test) for the pairwise comparison of spectral density at f0 = 1 (red), 8 (black), and 30 Hz (blue) with no spiking (broken lines: P = 10−3, Bonferroni corrected) for the cases shown in F–H. L–N: same analyses introduced in I–K but instead of using the EAP waveform of a single neuron we use EAP waveforms from all neurons of a particular cell type (8 L23, 4 L4, and 12 L5 pyramidal neurons) to create extracellular voltage traces (as the ones shown in B) to emulate multiunit activity (MUA) with mean spike frequency fMUA= 8, 32, and 96 Hz. Statistical significance (t-test, dashed line: P = 10−3, Bonferroni corrected) of the difference in spectral power between control (no spiking) and spiking traces at different frequencies for intact (red) and de-spiked (black) EAP waveforms. Lines of the same color show the result from different EAP waveforms as measured by different sites along the shank by considering the strongest and 2nd and 3rd strongest EAP signals both for the intact and de-spiked EAP waveforms with the lowest P value obtained for strongest EAP waveforms. For fMUA equal or larger than 32 Hz, intact as well as de-spiked waveforms of all pyramidal cell types significantly impact spectral density as low as 20 Hz.

