Fig. 5.
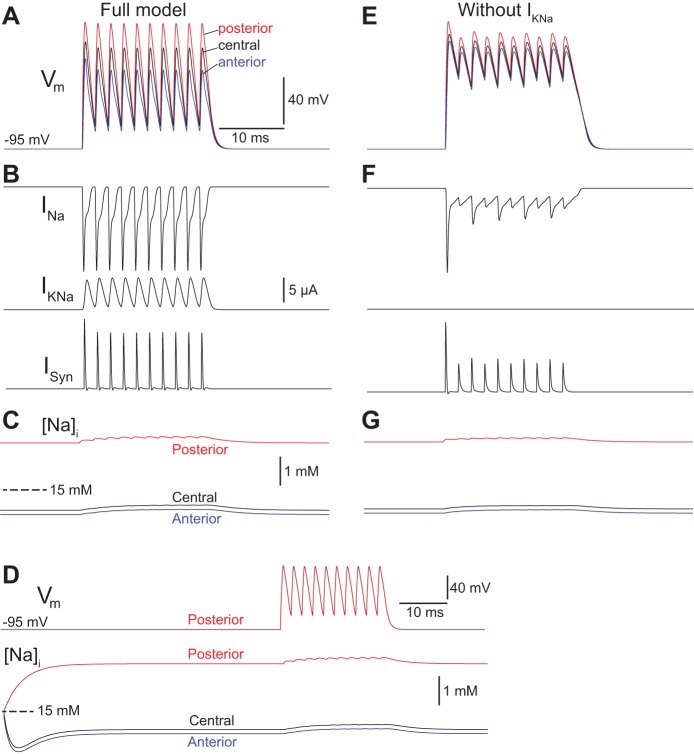
Computational simulations of electrocyte APs in a model electrocyte with (A–D) and without KNa channels (E–G). A: membrane potential (Vm) of the posterior (red), central (black), and anterior (blue) compartments of a model cell with KNa during a train of 10 APs elicited at 500 Hz by simulated synaptic conductances. B: time course of the Na+ current (INa), KNa current (IKNa), and synaptic current (ISyn) during the AP train shown in A. C: time course of internal Na+ concentrations ([Na+]i) in the posterior (red), central (black), and anterior (blue) compartments during the AP train shown in A. The different initial Na+ concentrations reflect the equilibrium of resting Na+ leak, pumping, and diffusion rates as shown in D. D: posterior Vm and time course of [Na+]i in the posterior (red), central (black), and anterior (blue) compartments during the same simulation shown in A, but on an expanded timescale that shows the initial changes in Na+ concentrations as the Na+ leak, pumping, and diffusion processes reach equilibrium. E: Vm of the posterior (red), central (black), and anterior (blue) compartments of a model cell without KNa during a train of 10 APs elicited at 500 Hz by simulated synaptic conductances. F: time course of INa, IKNa, and ISyn during the AP train shown in E. G: time course of [Na+]i in the posterior (red), central (black), and anterior (blue) compartments during the AP train shown in E. The different initial Na+ concentrations reflect the equilibrium of resting Na+ leak, pumping, and diffusion rates as shown in D.

