Fig. 3.
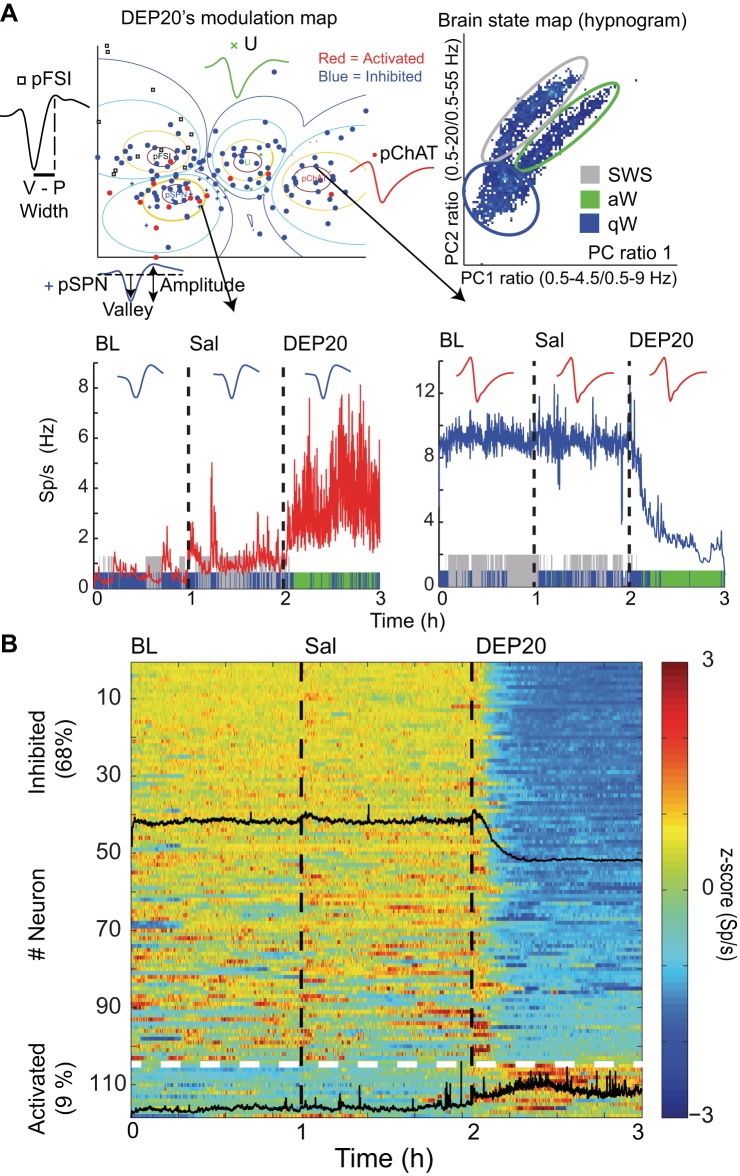
Intragastric infusions of DEP20 modulate nucleus accumbens (NAc) shell spiking activity. A, top left: a modulation map for DEP20 responses was computed with 154 neurons by using a fuzzy cluster algorithm to classify them into 4 putative cell types: pSPN, medium spiny projection neuron (+); pFSI, fast-spiking interneuron (□), pChAT, choline acetyltransferase interneurons (●); and U, unidentified (×) (see Table 1). For each cell type, a representative waveform is given as well as significantly inhibited (blue dots) and activated responses (red dots). V-P is the valley-to-peak width and a waveform illustrating the amplitude. Top right: a brain state map (hypnogram) was computed from the local field potentials (LFPs) in the NAc shell (see Fig. 4A) illustrating the 3 major behavioral states of an animal during the trial: active awake (aW), quiet awake (qW), and slow-wave sleep (SWS) (see Table 3). Each dot represents the principal component (PC) ratio between 2 power ranges for each second of LFP activity. Each dot falling into the gray ellipsoid corresponds to periods when the animals were in SWS, and the blue and green ellipsoids represent periods when the animals were in the qW and aW states, respectively. Bottom left: excitatory changes from a representative pSPN during baseline (BL), saline (Sal), and DEP20 infusion. During the transitions between SWS and qW states, the firing rate transiently increased but dramatically increased after infusion of DEP20. The colors on the abscissa represent blue, gray, and green for the qW, SWS, and aW states, respectively. Bottom right: inhibitory response of a representative pChAT neuron for the BL, Sal, and DEP20 epochs. B: population responses of 118 (of 154) neurons recorded during the BL, Sal, and DEP20 epochs. The activity of each neuron is normalized to its z-score value and is plotted in a color-coded population peristimulus time histogram (PSTH) showing that 68% (n = 104; black overlap line indicates average population response) were inhibited by DEP20 and 9% (n = 14) were activated. The other neurons (23%) were unaffected. The horizontal dotted white line indicates the division between inhibited and activated responses.

