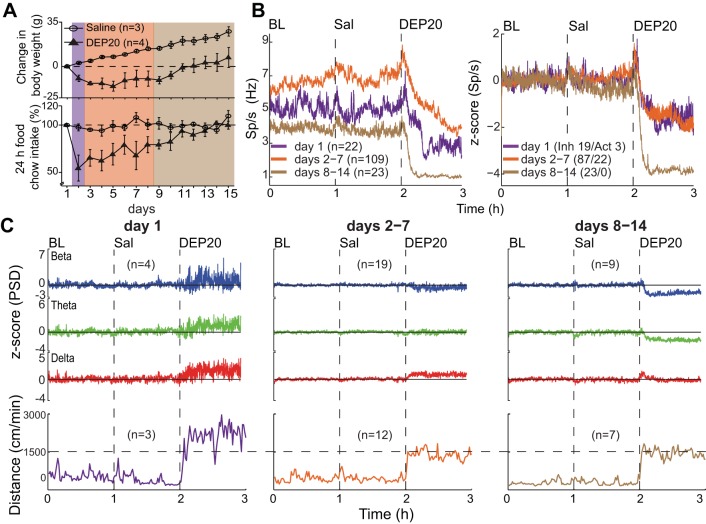
Fig. 5.
Behavioral and neuronal changes of NAc shell activity across 14 days of DEP20 treatment. A: plots of weight loss and food intake over 14-day treatments of saline or DEP20. With intragastric saline the animal's weight monotonically increased across days, whereas for DEP20, after a decrease that lasted until day 9, the animals gained weight at the same rate as the saline-treated animals. The DEP20 group transiently reduced food intake and then increased it with increasing treatment days. Purple shading indicates day 1, orange days 2–7, and brown days 8–14. B, left: a plot of the neuronal population changes observed across repeated intragastric DEP20 infusions. The colors codes are the same as in A. Relative to treatment day 1, during days 2–7, DEP20 increased global firing rates during BL and Sal epochs, whereas after DEP20 for days 8–14, the activity decreased. For days 8–14 relative to baseline, the activity is lower in all 3 epochs. Right, normalized activity in the BL, Sal, and DEP20 epochs. The latter reveals a much larger inhibition during days 8–14. The ratios of inhibitory to activated responses are also presented. C, top: changes in the LFP PSDs at beta, theta, and delta frequencies across days. All DEP20-evoked oscillations were positive at day 1, but all decreased across days, with the beta and delta oscillations becoming negative at days 8–14. Bottom, locomotion evoked by DEP20 across days.

