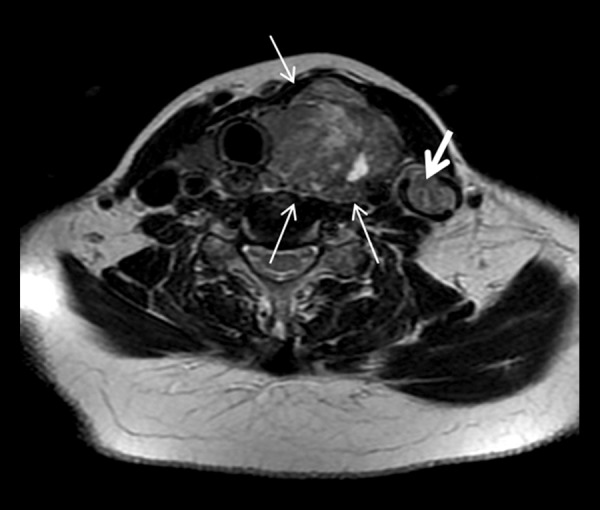
Figure 3.

Transvers T2 weighted image of the neck shows a heterogeneous high signal intensity mass (thin arrow) which compresses and displaces the trachea to the right and similar signal intensity of the tumour thrombus (thick arrow) in the İJV and periferally luminal signal void area which shows the partially blood flow.
