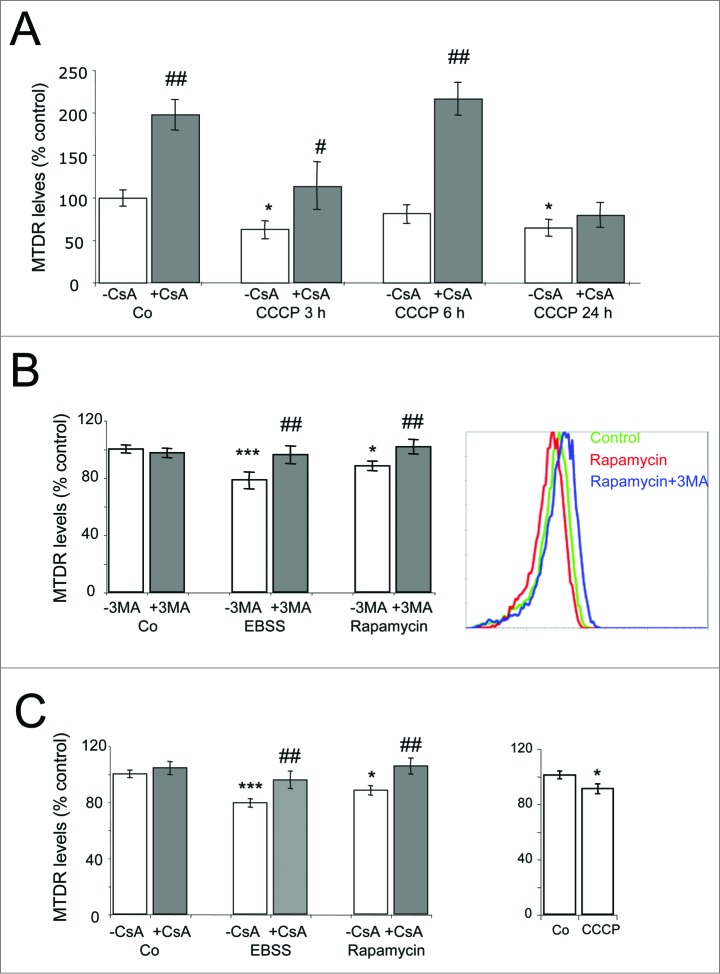
Figure 5.
Mitophagy assessment in primary cells. (A) Primary cultures of astrocytes were treated with 25 μM CCCP for the indicated times in the presence or absence of CsA. * Indicates comparisons between control (Co) and CCCP. # Indicates differences between presence and absence of CsA within treatments. (B, C) E13.5 retinas were incubated with EBSS (6 h), rapamycin (24 h) or CCCP (6 h), in the absence or presence of 3MA (B) or CsA (C), and were then dissociated and incubated with MTDR for flow cytometry analysis. * Indicates comparisons between control (Co) and treatments, EBSS or rapamycin. # Indicates differences between presence and absence of CsA or 3MA within treatments. * or #P < 0.05, ** or ##P < 0.01, *** or ###P < 0.001.

