Fig. 2.

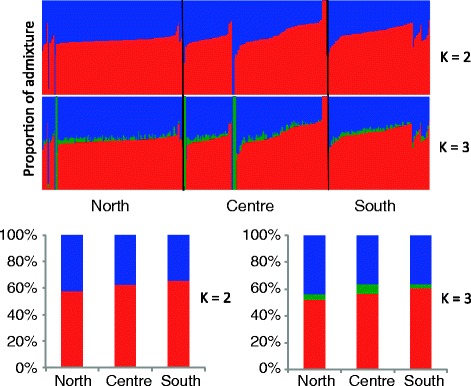
ADMXITURE analysis of the Malay populations classified according to regions. The bottom plots represented by percentages (Y-axis) indicates the average ADMIXTURE values for each region

ADMXITURE analysis of the Malay populations classified according to regions. The bottom plots represented by percentages (Y-axis) indicates the average ADMIXTURE values for each region