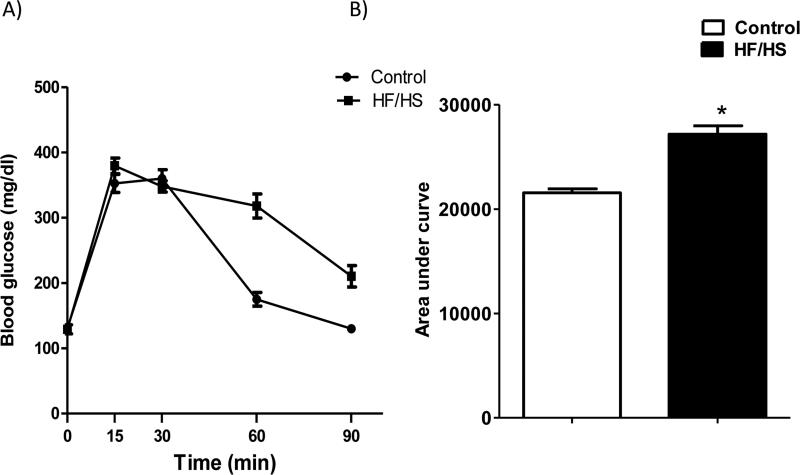
Figure 3.
Maternal glucose tolerance test (A) at E18.5 after a 4-hour fast in mice fed a control or HF/HS diet. An i.p. injection of 2 g/kg of a 30% glucose solution was given, and blood glucose was determined in samples obtained from the tail vein 0-90 min after glucose administration. Histogram (B) summarize the area under curve of GTT. Values are means ± SEM; n= 4 (Control) and 5 (HF/HS). *P < 0.05 vs. control; unpaired Student's t-test.

