Figure 5.
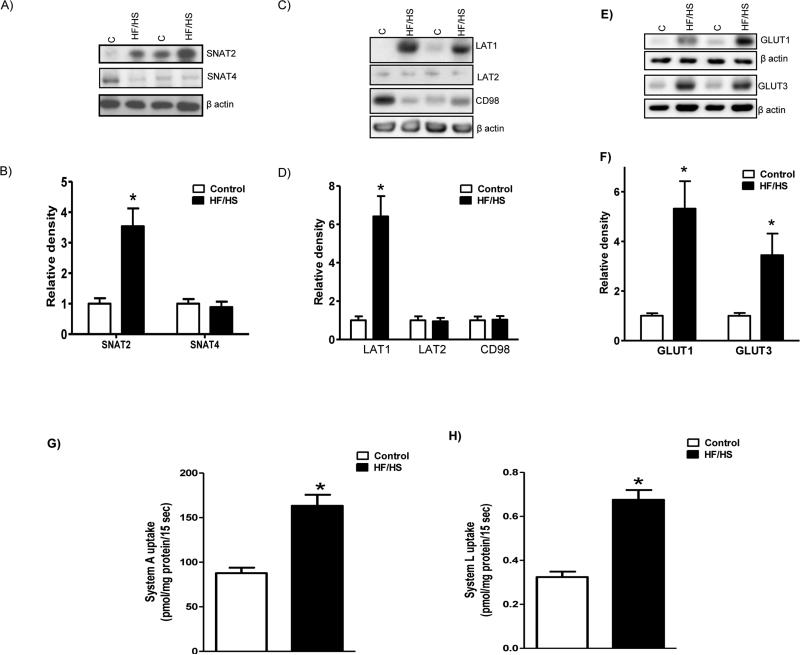
TPM nutrient transporter isoform expression (A-F) and activity (G-H). A and B). Protein expression of System A amino acid transporter isoforms in TPM. Representative Western blots for (A) SNAT2 and 4 in TPM isolated from control and HF/HS diet fed animals at E 18.5. Histogram (B) summarizes the Western blotting data from control (C, n = 6) and HF/HS (n = 6). Equal loading was performed. After normalization to β-actin, the mean density of C samples was assigned an arbitrary value of 1. Values are given as means + SEM; *P < 0.05 vs. control; unpaired Student's t-test.
C and D). Protein expression of System L amino acid transporter isoforms in TPM. Representative Western blots for (C) LAT1, LAT2 and CD98 in TPM isolated from placentas of controls and HF/HS diet fed mice at E 18.5. Histogram (D) summarizes the Western blotting data from control (C, n = 6) and HF/HS (n = 6). Equal loading was performed. After normalization to β-actin, the mean density of C samples was assigned an arbitrary value of 1. Values are given as means + SEM; *P < 0.05 vs. control; unpaired Student's t-test.
E and F). Protein expression of glucose transporter isoforms in TPM. Representative Western blots for (E) GLUT1 and GLUT3 in TPM isolated from placentas of control and HF/HS diet fed mice at E 18.5. Histogram (F) summarizes the Western blotting data from control (C, n = 6) and HF/HS (n = 6). Equal loading was performed. After normalization to β-actin, the mean density of C samples was assigned an arbitrary value of 1. Values are given as means + SEM; *P < 0.05 vs. control; unpaired Student's t-test.
G and H). TPM system A and L activity. System A transport activity (G) was determined as sodium dependent [14C]-MeAIB uptake, and System L transport (H) was measured as [3H]-L-leucine uptake in isolated TPM vescicles. MeAIB, 2-Methylaminoisobutyric acid; Leu, Leucine. Values are given as means + SEM; n=6/group; *P < 0.05 vs. control; unpaired Student's t-test.

