
Figure 10.
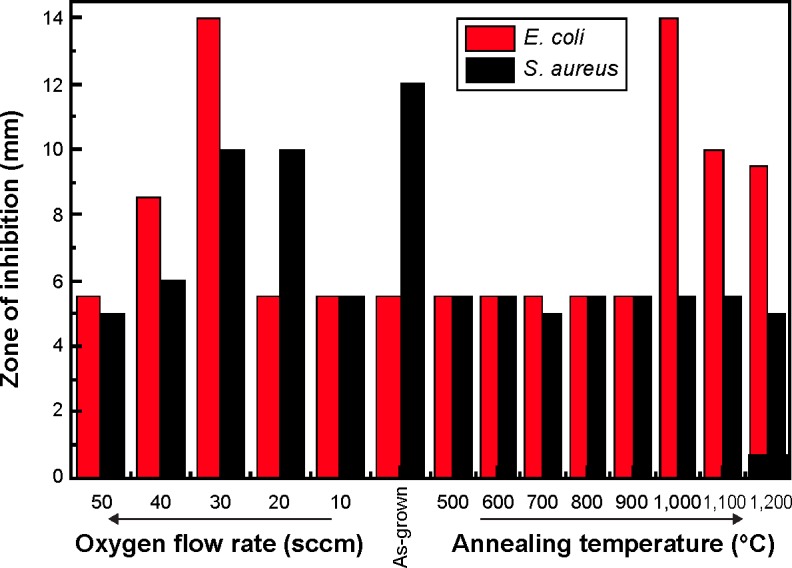
Bar chart of the zone of inhibition of the oxygen plasma–processed (left) and Ar-annealed (right) ZnO nanostructures against Escherichia coli (black bar) and Staphylococcus aureus (red bar).
Official websites use .gov
A
.gov website belongs to an official
government organization in the United States.
Secure .gov websites use HTTPS
A lock (
) or https:// means you've safely
connected to the .gov website. Share sensitive
information only on official, secure websites.
Bar chart of the zone of inhibition of the oxygen plasma–processed (left) and Ar-annealed (right) ZnO nanostructures against Escherichia coli (black bar) and Staphylococcus aureus (red bar).