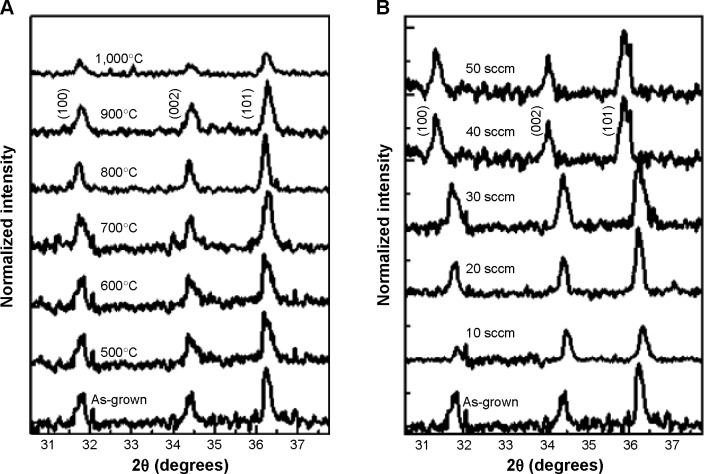
Figure 3.
Magnified portion of the XRD patterns in the range from 31° to 36° for (A) Ar-annealed ZnO NS at different temperatures; (B) plasma-oxidized ZnO NS at different flow rates.
Note: A shift in (002) peak toward lower 2θ values was clearly observed in the plasma-oxidized NS.
Abbreviations: NS, nanostructure; XRD, X-ray diffraction.

