
Figure 6.
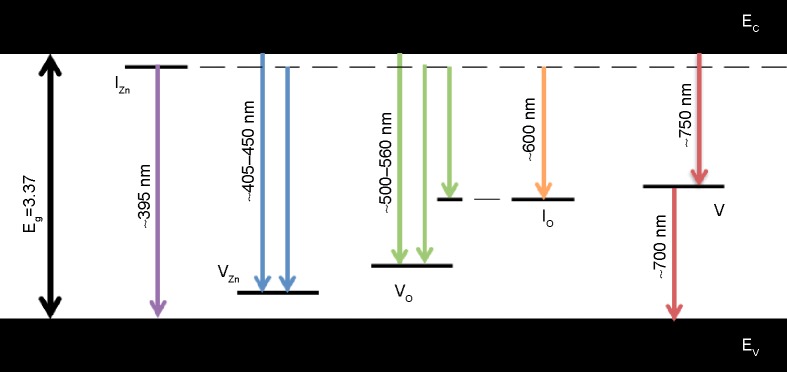
Schematic diagram showing the possible radiative transitions in ZnO due to various defects, such as Zn and O interstitials, and vacancies.
Notes: The diagram was used to identify the origin of various bands and peaks in the PL spectra from the postprocessed ZnO nanostructures shown in Figure 7. Data from Faber et al.24
Abbreviations: EC, conduction band edge; Eg, band gap energy; EV, valence band edge; IO, oxygen interstitials; IZn, Zn interstitials; PL, photoluminescence; VO, oxygen vacancies; VZn, zinc vacancies.