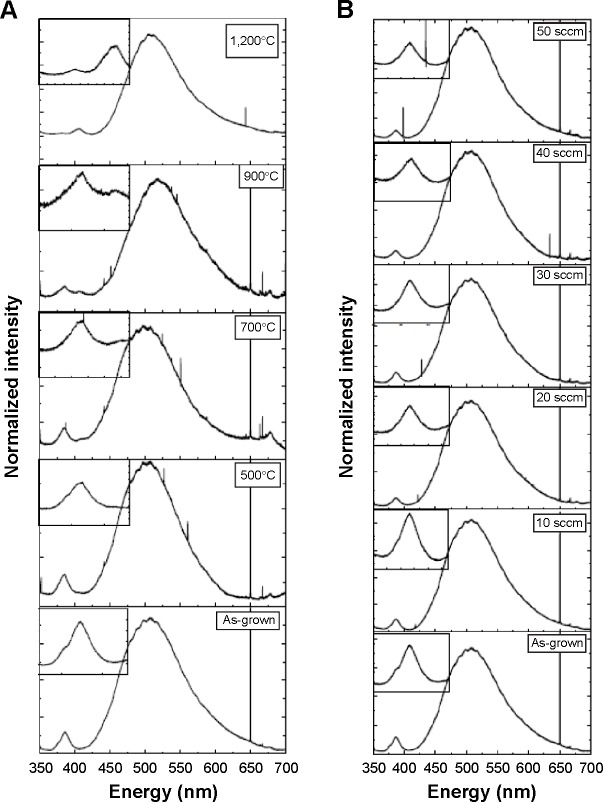
Figure 7.
Room temperature photoluminescence spectroscopy of (A) Ar-annealed and (B) oxygen plasma–processed ZnO nanostructures at various annealing temperatures and oxygen flow rates, respectively.
Notes: The bottom spectra of both columns represent the PL spectra from the as-grown ZnO nanostructures. The sharp line at approxiamtely 700 nm is the Raman mode of ZnO, which was used to normalize the PL spectra. Insets show the zoomed part of NBE PL spectra of the processed ZnO NSs.
Abbreviations: PL, photoluminescence; NBE, near band edge emission; NSs, nanostructures.

