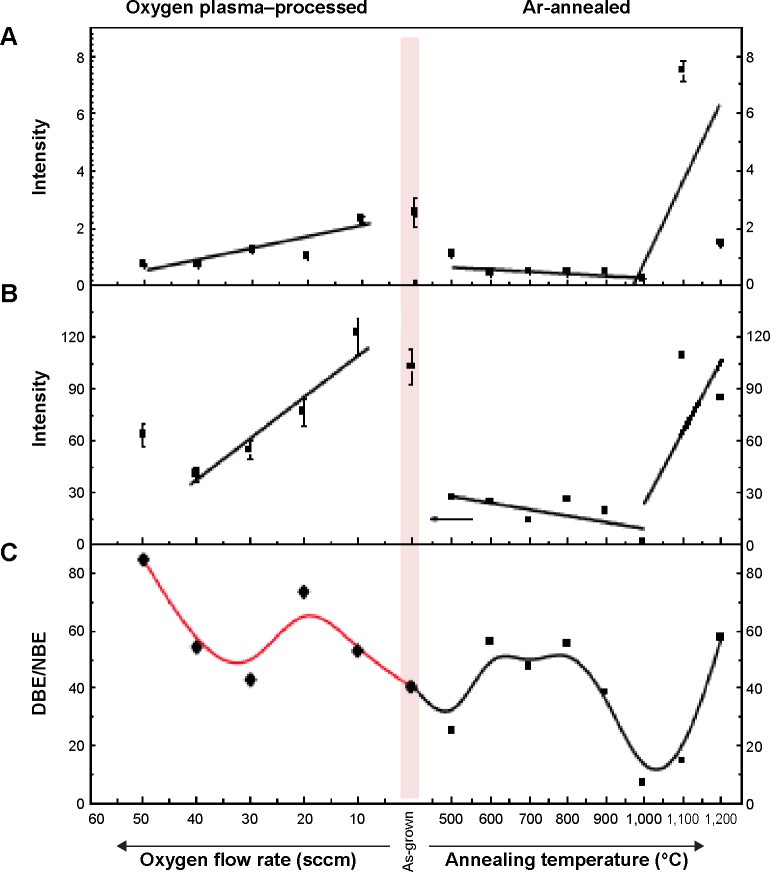
Figure 8.
Variation in the (A) near band edge emissions (NBE), (B) defect assisted deep band emissions (DBE), and (C) ratio of the defect assisted deep band emissions to Near band edge emissions (DBE/NBE) of the processed ZnO NSs as a function of O2 flow rates (left panel) and annealing temperatures in Ar (right panel), respectively.
Notes: The decrease in integrated intensities of the both NBE and BDE was larger for oxidized ZnO NSs.
Abbreviations: NBE, near band edge emissions; DBE, defect assisted deep band emissions.

