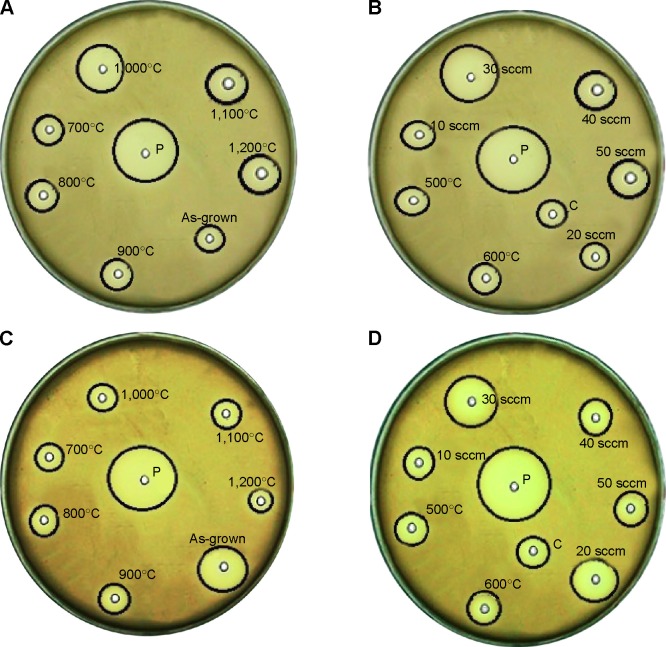
Figure 9.
Optical micrographs of agar plates, showing the variation in the zone of inhibition exhibited by as-grown, Ar-annealed, and oxidized ZnO NSs. (A) and (B) for Escherichia coli while (C) and (D) for Staphylococcus aureus.
Notes: C represents the control for the ZnO powder, and P represents the kanamycin (positive control).
Abbreviation: NS, nanostructure.

