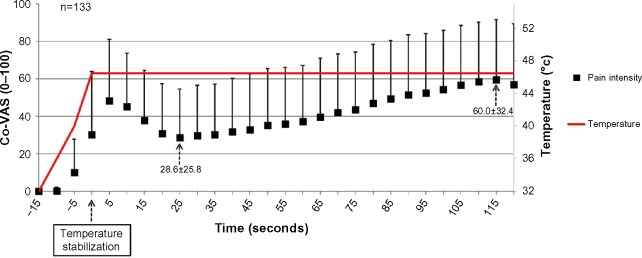
Figure 1.

Pain ratings of subgroup I (“typical”) (n=133).
Note: Results are presented as mean ± SD.
Abbreviations: Co-VAS, computerized visual analog scale; SD, standard deviation.

Pain ratings of subgroup I (“typical”) (n=133).
Note: Results are presented as mean ± SD.
Abbreviations: Co-VAS, computerized visual analog scale; SD, standard deviation.