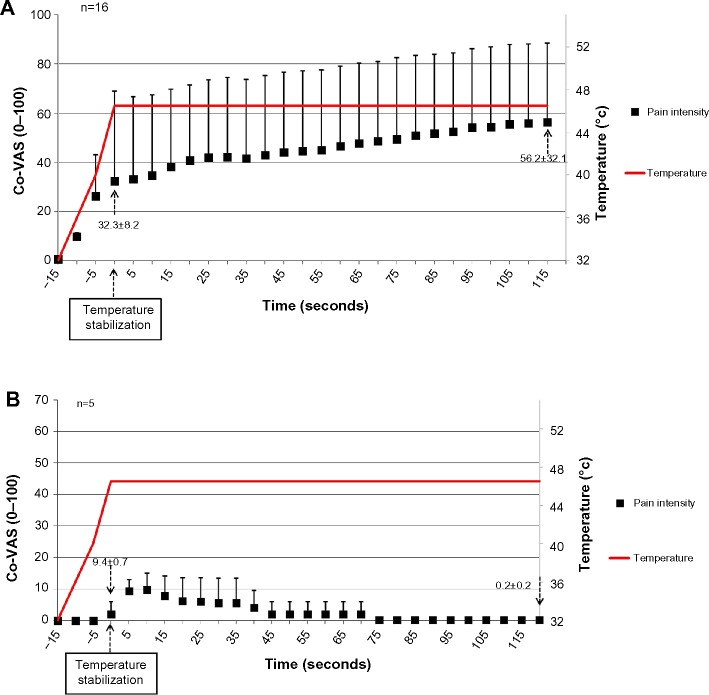
Figure 3.
Pain ratings of subgroup II (“atypical”) (n=21).
Notes: (A) Subjects who exhibited a constant increase in pain ratings throughout the entire stimulation (n=16). (B) Subjects who did not show pain summation (n=5). Results are presented as mean ± SD.
Abbreviations: Co-VAS, computerized visual analog scale; SD, standard deviation.

