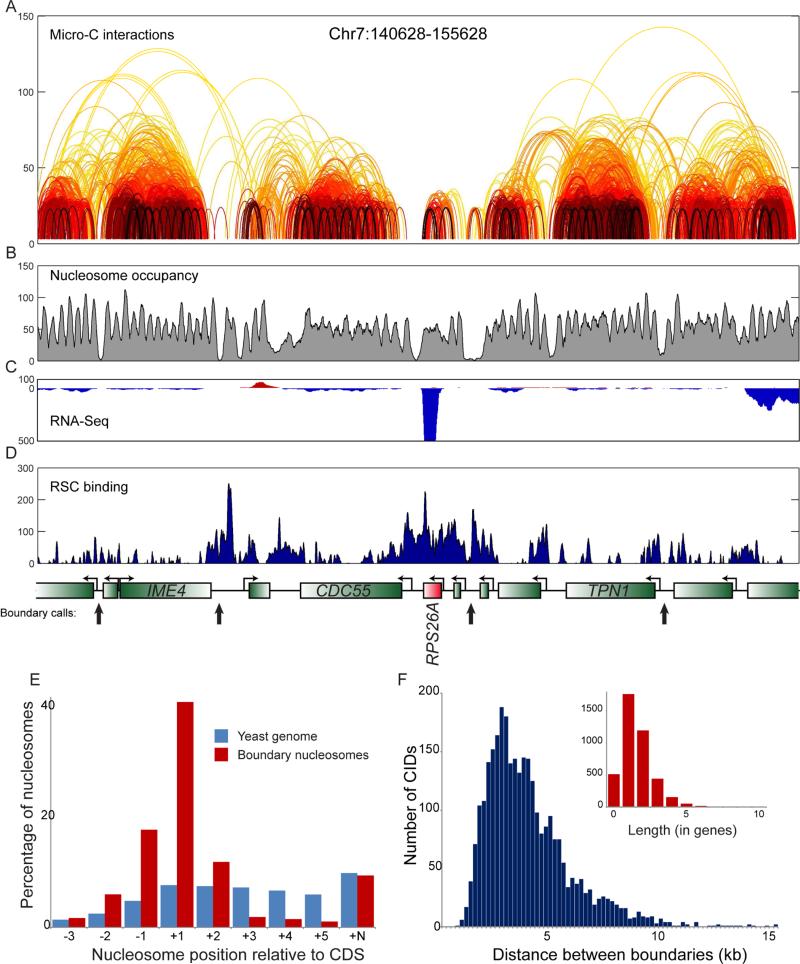
Figure 2. Properties of folding boundaries.
(A-D) Example of boundary identification. Data for a 15 kb locus, with arcs showing interactions between nucleosomes, colored as in Figure 1B. Interactions observed only once in the entire dataset have been removed for clarity. Gene annotations for this locus, and boundary calls shown in black arrows, are shown below panel (D). Emphasis on RPS26A shows both the overall lack of local Micro-C interactions, as well as the unusually strong boundary activity associated with this highly-transcribed gene. RNA-Seq data (B), nucleosome positioning data (C) and Sth1 ChIP-Seq enrichment (Lopez-Serra et al., 2014) (D) are also shown for this locus to emphasize the correlation between RSC-enriched promoters and boundary activity. (E) Boundaries between CIDs occur at promoters. For each nucleosome position relative to a gene, the fraction of boundary nucleosomes, or of all nucleosomes genome-wide, is shown on the y axis. As boundaries as defined here fall between adjacent nucleosomes, we show data here for the downstream boundary nucleosome, relative to underlying gene orientation – upstream nucleosomes are correspondingly enriched for −1 nucleosomes (and +N nucleosomes). (F) Length distribution of CIDs. Distribution of distances between boundary nucleosomes is plotted in blue using base pairs for the x axis, and in the inset using gene count as the scale. See also Supplemental Figures S3-S4.

