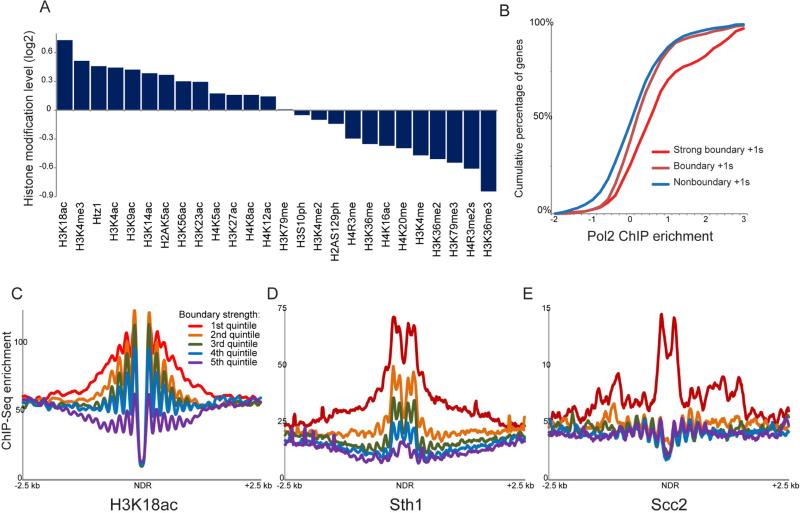
Figure 3. Features of CID boundaries.
(A) Average histone modification levels are shown for all boundary nucleosomes (using both nucleosomes flanking a boundary). Histone modification data are from (Weiner et al., 2015), normalized to nucleosome occupancy, and expressed as log2 enrichment relative to all nucleosomes genome-wide. (B) Boundary activity at promoters is associated with elevated transcription rates. For each promoter, the transcription rate is defined as the Pol2 level (Kim et al., 2010) of the more highly-transcribed of the two adjacent genes, and cumulative plots show Pol2 enrichment values for nonboundary promoters, for all boundary promoters, and for the strongest half of boundary promoters. (C-E) Boundary nucleosome-depleted regions (NDRs) are associated with high levels of H3K18ac, RSC, and cohesin relative to all NDRs genome-wide. In each panel, all NDRs in the yeast genome were identified, and Micro-C interactions that cross the NDR were calculated. NDRs were sorted according to quintiles based on the abundance of NDR-spanning Micro-C reads – the first quintile encompasses the 1300 NDRs with the fewest NDR-spanning Micro-C ligation products, etc. – and ChIP-Seq data for the indicated factors was averaged for each quintile. See also Supplemental Figure S5.

