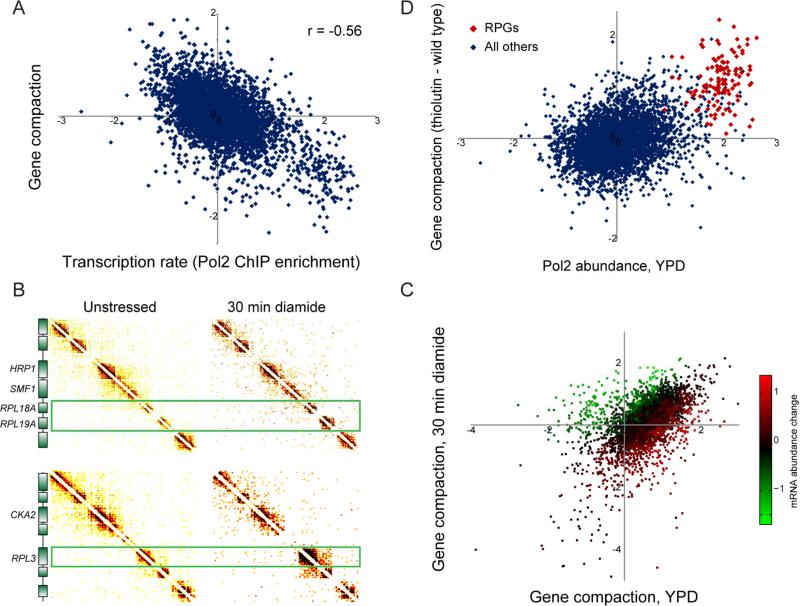
Figure 4. Gene-specific compaction is anticorrelated with transcription.
(A) Scatterplot comparison of gene compaction with transcription rate. X axis shows Pol2 ChIP data from (Kim et al., 2010), y axis shows gene compaction from this dataset based specifically on interactions beyond N/N+3, normalized for nucleosome occupancy and gene length (Supplemental Figures S6A-D). (B) Changes in transcription affect gene compaction. Micro-C was carried out for yeast subject to 30 minutes of 1.5 mM diamide, a sulfhydryl-reducing agent that alters transcription of ~20% of the yeast genome (Gasch et al., 2000). Here, Micro-C contact matrices for unstressed and diamide-stressed yeast show regions surrounding three ribosomal protein-encoding genes (RPGs), which are strongly repressed in response to diamide stress and which exhibit a dramatic increase in local compaction. (C) Systematic analysis of diamide-induced changes in chromosome folding. Here, gene compaction is scatterplotted for unstressed and diamide-stressed yeast, with points color-coded according to the corresponding mRNA abundance changes in diamide (smoothed by 20 nearest neighbors). (D) Global inhibition of transcription leads to increased compaction over normally highly-transcribed genes. Here, Pol2 abundance at t=0 is plotted (x axis) against the change in gene compaction in response to 45 minutes of treatment with the RNA polymerase inhibitor thiolutin. Red points show RPGs. See also Supplemental Figure S6.

