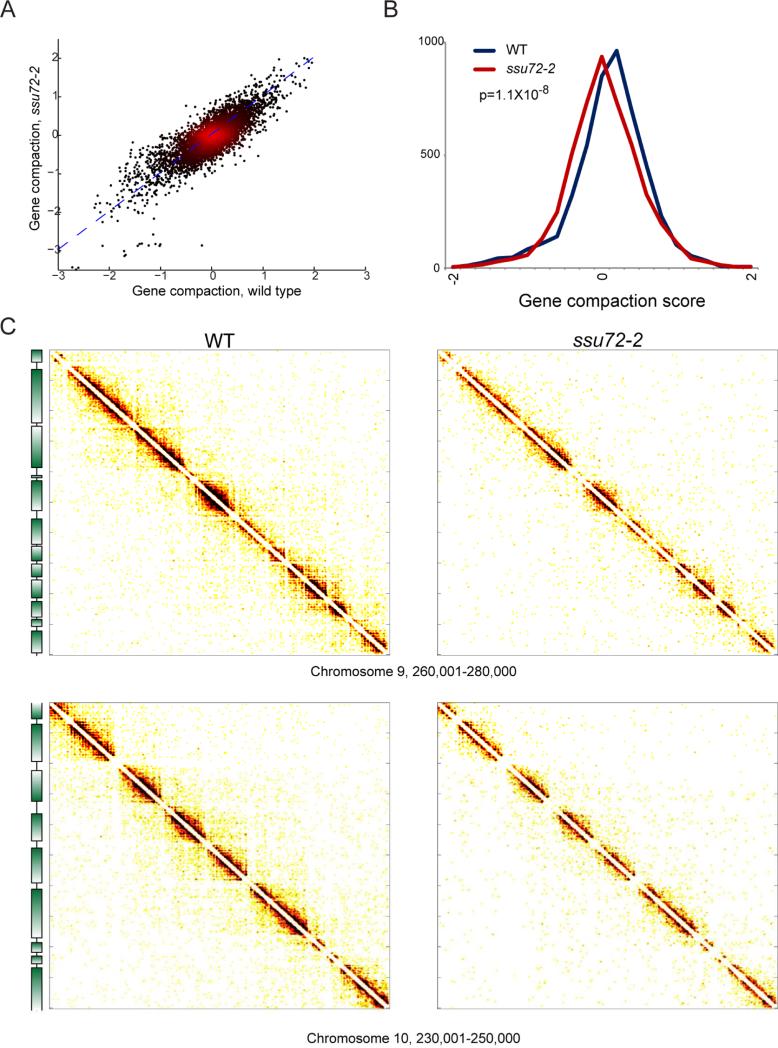
Figure 5. Modest effects of ssu72-2 on global gene compaction.
A) Micro-C was carried out for three replicate cultures of ssu72-2. Compaction scores for all genes are scatterplotted for wild-type and ssu72-2 mutants, as indicated. (B) Histogram of gene compaction scores for wild-type and ssu72-2 mutants, showing a subtle but significant (p < 1.2e-8, KS test) general loss of gene compaction in the mutant. (C) Two 20 kb × 20 kb matrixes showing wild type and ssu72-2 Micro-C data, as indicated. See also Supplemental Figure S6.

