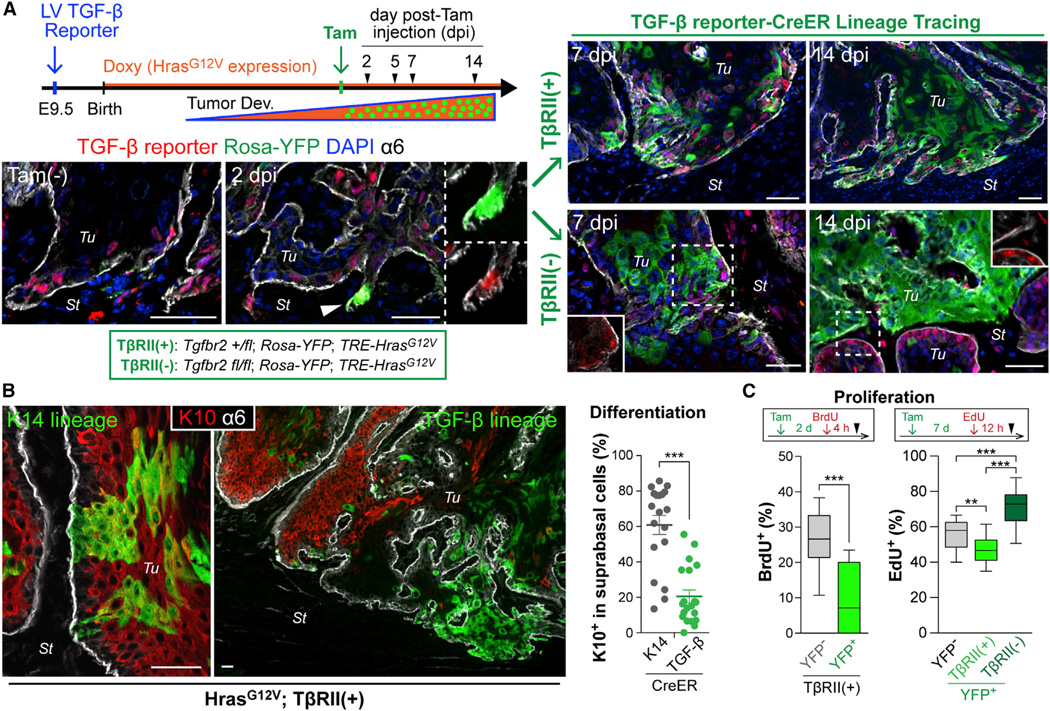
Figure 2. TGF-β Signaling-Driven Lineage Tracing during Tumor Development.
(A) Experimental scheme and representative images of TGF-β signaling-driven lineage tracing. Once tumors form (>7 mm), NLS-mCherry is detected in TGF-β-responding transduced cells (Tam-). A single i.p. injection of low-dose Tam elicits Rosa-YFP recombination in a small subset of these cells within 2d post-Tam injection (2dpi). Note YFP/mCherry double-positive cell at invasive front. YFP-marked cells undergo clonal expansion, evident at 7 and 14 dpi, and now independent of TGF-β reporter activity (right). Note difference in clonal expansion rate and morphology based upon whether the initial marked cell is from a tumor initiated on a Tgfbr2 (fl/+) (top) or (fl/fl) (bottom) genetic background.
(B) Immunolabeling (left) and quantifications (right) show that suprabasal differentiation marker K10 preferentially marks YFP+ clones (n=19 analyzed) derived from K14-CreER-induced basal tumor cells. Note that TGFβ-CreER-induced lineage tracing marks TGF-β-responding basal cells that yield YFP+K10neg clones (n=21). Data are mean ± SEM.
(C) S-phase analysis during lineage tracing. BrdU or EdU was administered at 2 or 7 dpi, respectively (see Figures S2H and S2I), and YFPneg and YFP+ basal tumor cells were quantified for nucleotide incorporation (n = 11–15).
Data are box-and-whisker plots. Scale bars, 50 µm. See also Figure S2.

