Fig. 1.

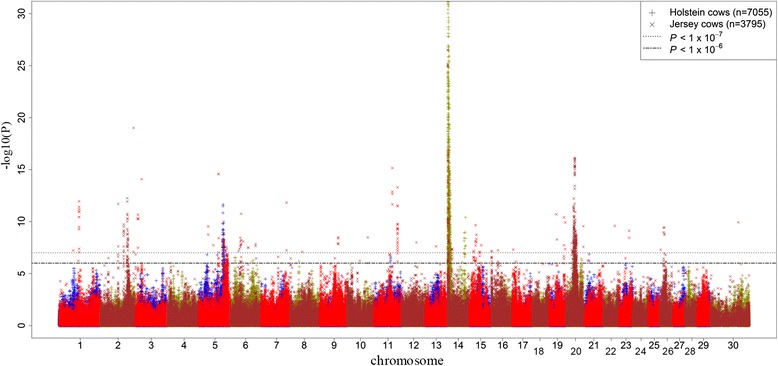
Distribution of additive SNP effects for milk yield. Manhattan plot of all additive SNP effects for milk yield in discovery and validation populations with chromosome number on horizontal axis and –log10(P-value) on vertical axis

Distribution of additive SNP effects for milk yield. Manhattan plot of all additive SNP effects for milk yield in discovery and validation populations with chromosome number on horizontal axis and –log10(P-value) on vertical axis