
Figure 2. Spatiotemporal dynamics of HIF1α protein during cardiogenesis.
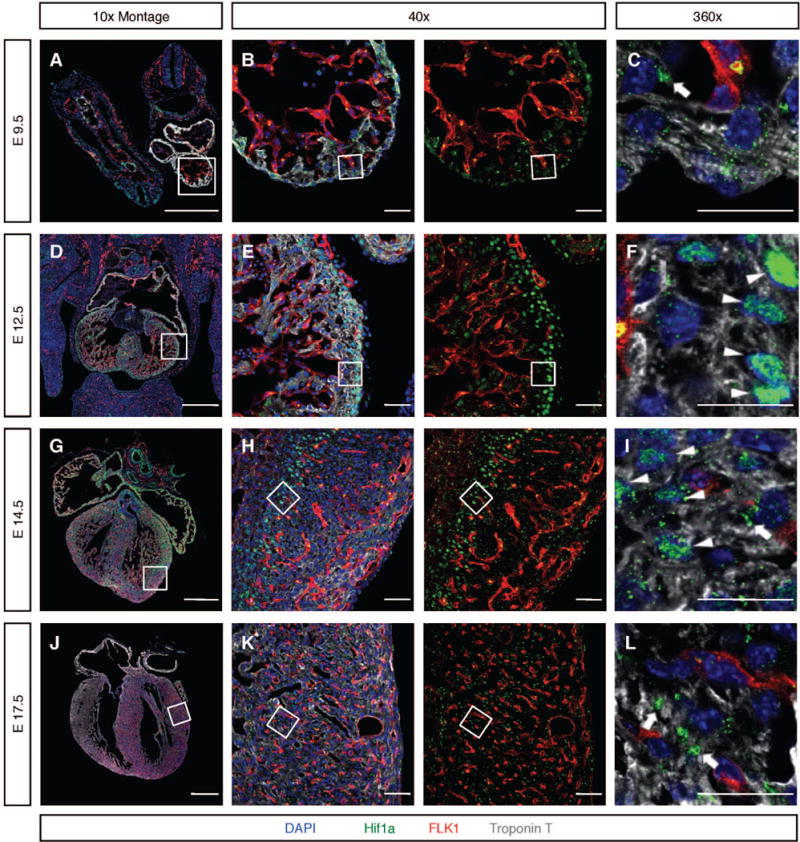
A–C) In E9.5 fCMs, HIF1α was retained in extra-nuclear aggregates (arrow in C). D–F) At E12.5, HIF1α accumulated in nuclei of fCMs located in non-vascularized areas of the myocardium, including fCMs of the inner core of the interventricular septum (IVS), and outermost layers of the compact wall (arrowheads) G–I) At E14.5, the coronary vascular system has colonized most of the ventricular free walls. At this stage, most fCMs displayed cytoplasmic HIF1α (arrow in I) and only a small fraction of fCMs located between the endocardium and the leading edge of the progressing coronary vasculature exhibited significant levels of nuclear HIF1α (boxed area in H and arrowheads in I). J–L) At E17.5, the coronary vascular system has colonized the entire heart and HIF1α was no longer detectable in the nucleus of fCMs, being present only in cytoplasmic aggregates (arrows in L). To allow better visualization of the location of HIF1α relative to the coronary endothelium, all 40× images are shown in two distinct panels: a four-color merge and a red and green only merge. Boxed areas are imaged in higher magnifications. Bars represent 500μm in the 10× montages and 20 μm in all other panels. See also Figure S1.