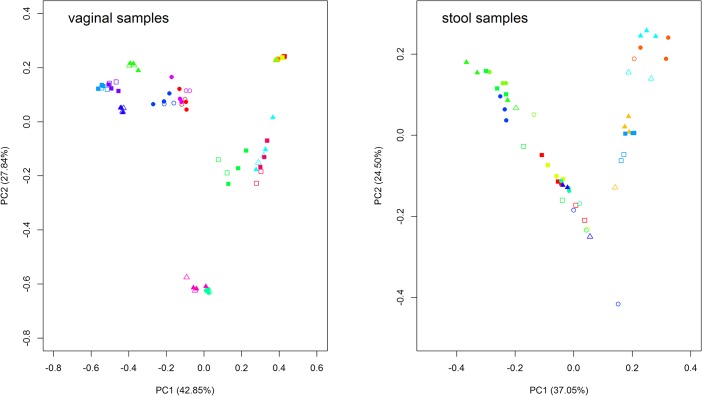
Fig 2. Principal coordinates analysis (PCoA) of weighted UniFrac distance.
Proportion of variance explained by each axis is denoted in the corresponding axis labels. Each symbol (designated by the combination of color and shape) represents each subject with the open symbols for the nested PCRs and the closed symbols for the standard PCRs. For example, the blue circles represent subject 1 with open blue ones for two nested PCR results and closed blue ones for three standard PCR results.

