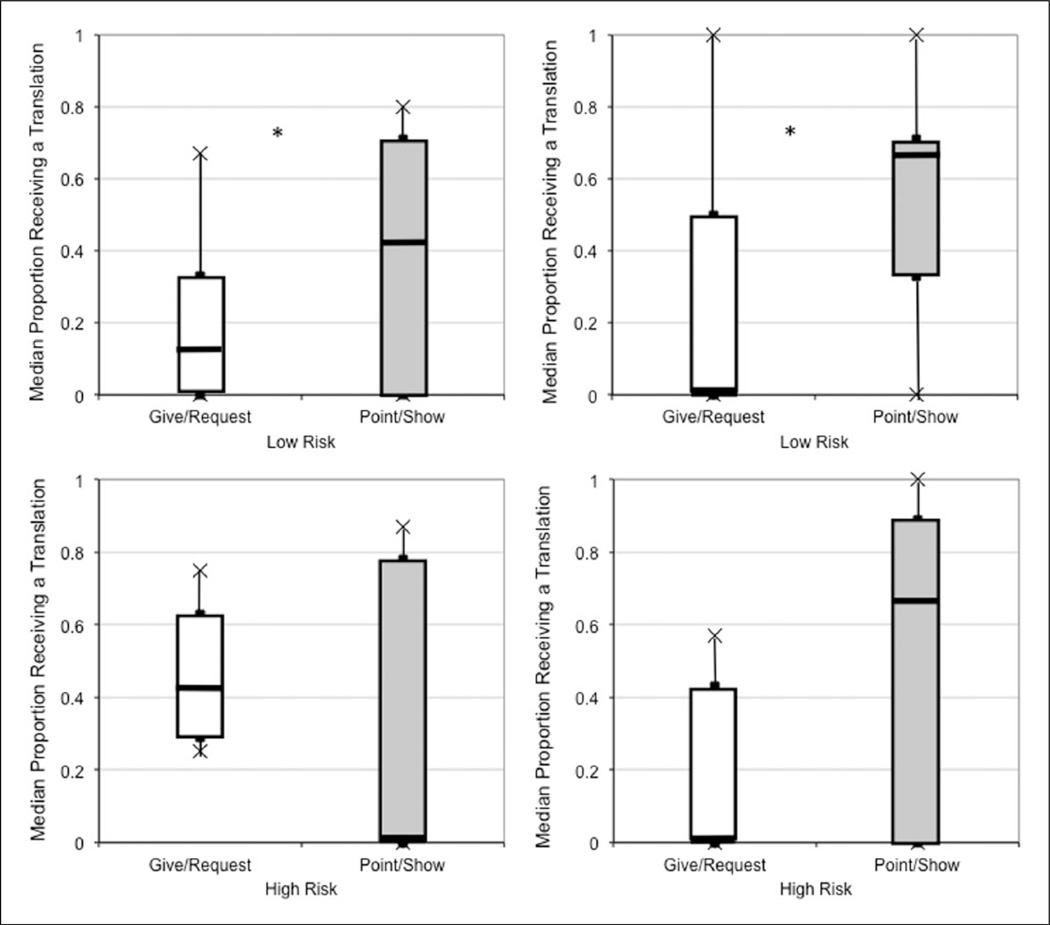
Figure 2.
Boxplots indicating proportions of infant Give/Request and Point/Show gestures that received a maternal translation at13 months (left) and 18 months (right) for the LR group (top panel) and HR group (bottom panel).
HR: high risk; LR: low risk.
The boxes represent the interquartile range for the proportion of gestures that received a translation; the solid lines in the figure represent the median, and the tails represent the minimum and maximum values.

