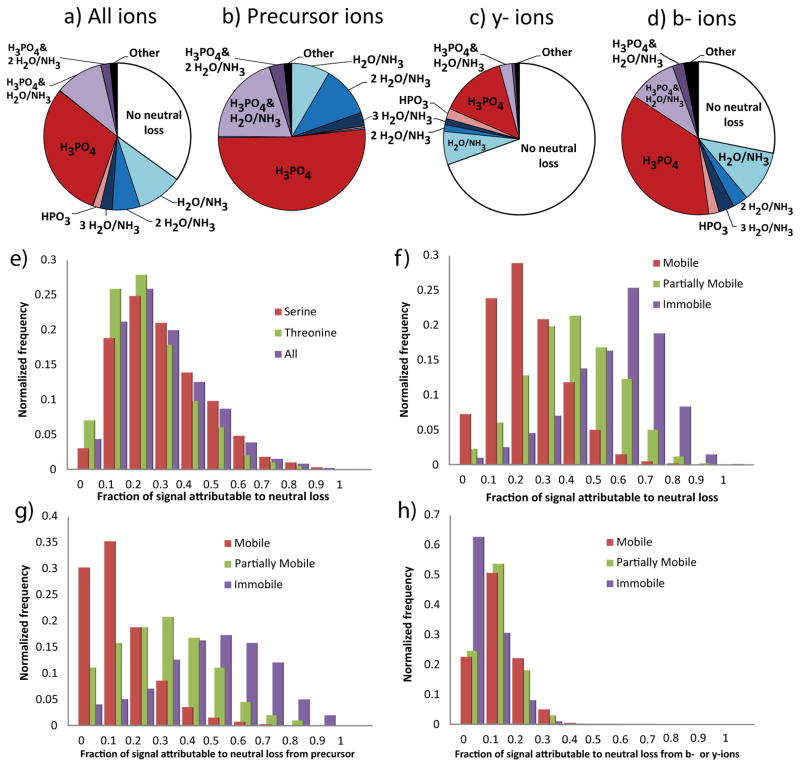
Figure 1.
Neutral loss characteristics of the fragmentation spectra of 5749 unique tryptic peptide ions containing a single pThr or pSer derived from samples of the human cell line WM239A. (ad) Distribution of identifiable ion intensity by type of neutral loss observed. (a) represents the total signal within the spectra, including b- and y-ions that do not contain the site of phosphorylation. (b) Precursor ions include only those ions that do not have a cleavage at the backbone. (c) b-ions and (d) y-ions include only those ions of the given series that contain the site of phosphorylation. (e–h) The distribution of the fraction of identifiable signal annotated to result from the neutral loss of phosphoric acid, binned by increments of 10% of all signal. Separated by identity of the phosphorylated residue (e) or the charge mobility of the precursor ion (f). (g) Signal annotated as precursor ion neutral loss. (h) Same as (f) except that only signal annotated to have at least one cleavage of the peptide backbone counted.

