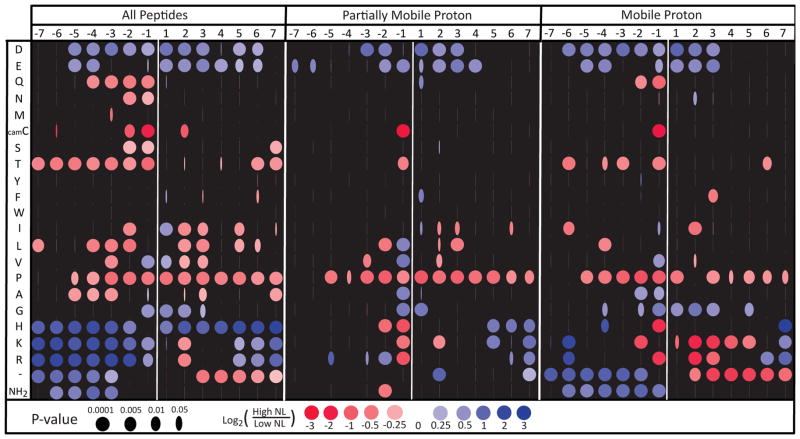
Figure 2.
The effects of peptide sequence adjacent to the site of phosphorylation on 34,057 unique spectra from the ISB PhosphoPep database. The horizontal axis represents the position of residues from 7 sites N-terminal to 7 sites C-terminal relative to the phosphorylated residue. The vertical axis denotes the presence of a particular amino acid at the position. ‘−‘ indicates that the peptide is not long enough to contain the site, thus ‘−‘ serves as a cumulative marker for the peptide terminus. NH2 represents the N-terminus. A blue dot indicates that the peptides with the specified amino acid at the specified position are more likely to have high neutral loss than low neutral loss. Red dots indicate that low neutral loss is more likely. Low neutral loss is defined as having neutral loss less than at least two-thirds of the peptides in the dataset (bottom tercile). High neutral loss is defined as greater than at least two-thirds dataset (top tercile). The width of the iris represents the multiple-hypothesis-corrected probability that this ratio could occur by chance if the indicated residue had no effect on neutral loss.

