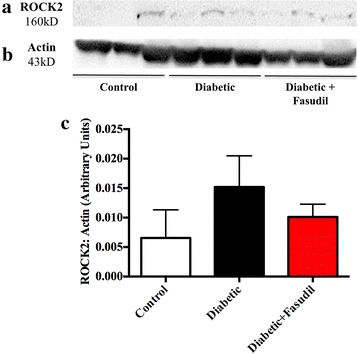
Figure 2.

Rho kinase 2 (ROCK2) expression in the left ventricle. Representative images of western blot membranes for ROCK2 (a) and actin loading control (b) from control, diabetic and diabetic rats treated with fasudil (10 mg/kg/day). No significant changes were observed among the three experimental groups. Panel c is the quantification of ROCK2 expression relative to actin. Data expressed as mean ± SEM. N = 6 per group.
