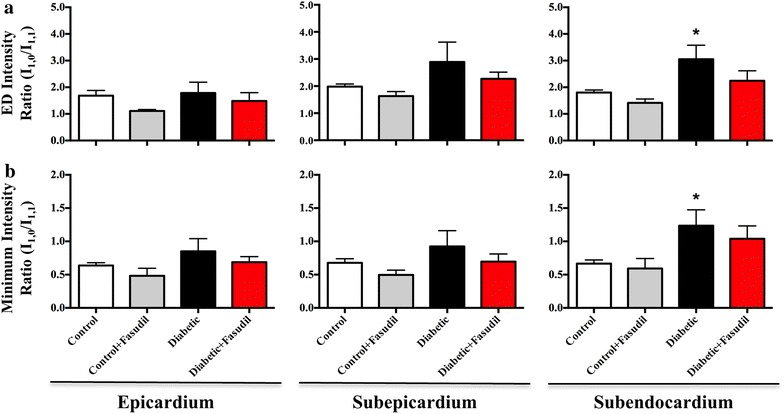
Figure 3.

Myosin mass transfer changes across the cardiac cycle. Mean intensity ratio (I1,0/I1,1) at end diastole (ED, a) and systolic minimum (b) in the epicardial, subepicardial and subendocardial layers of the left ventricle. Intensity ratio did not significantly differ between vehicle-treated control and diabetic rats or fasudil-treated (10 mg/kg/day) control and diabetic rats in the epicardium or subepicardium at either time point. In the deep subendocardial layer, diabetic rats had a significantly elevated ED and systolic minimum intensity ratio (P < 0.05). Data expressed as mean ± SEM. *P < 0.05 vs. control in the same myocardial layer. N = 4–6 per group.
